Cryptocurrency trading, known for its volatility and rapid market movements, demands constant vigilance and an in-depth understanding of various technical indicators. This article examines the latest trading signals for ten tokens, providing insights into their potential impacts on short-term trading strategies.
All signals are based on the hourly chart!
We will explore each token’s detected signal, support and resistance levels, profit potential, and backtest data to equip traders with information crucial for informed decision-making.
For more chart patterns, trading signals, and crypto data, download our app in the Appstore or Playstore: Download Now
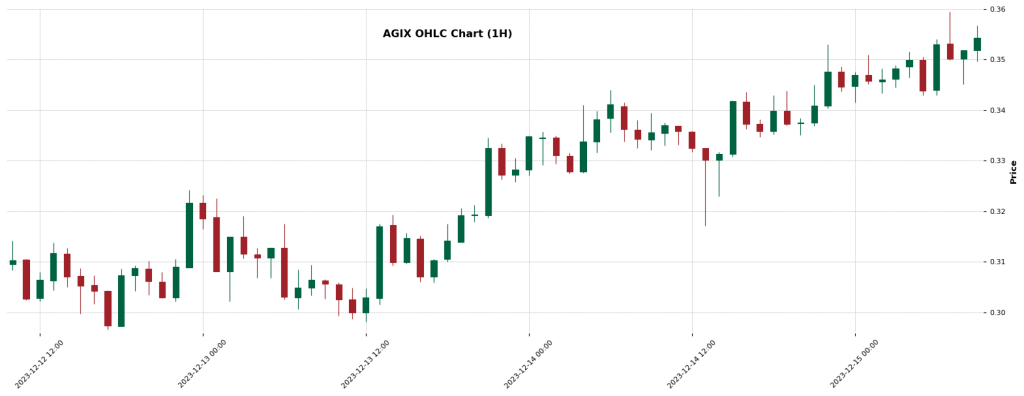
AGIX: A Cautious Approach Amid Bearish Signals
AGIX has shown a ‘MACD: Bearish Crossover’ signal, indicating a potential downturn. With current support at $0.3342 and resistance at $0.3673. According to these levels, the signal has a profit potential of 4.5%.
Backtest Data
Our algorithms analyzed more than three years of data for AGIX. Accordingly, backtesting of 243 signals reveals a success rate of 59.67% and an average profit potential of 7%. This dichotomy suggests that traders should be cautious and monitor additional market indicators closely.
BNB: Bearish Crossover Raises Caution
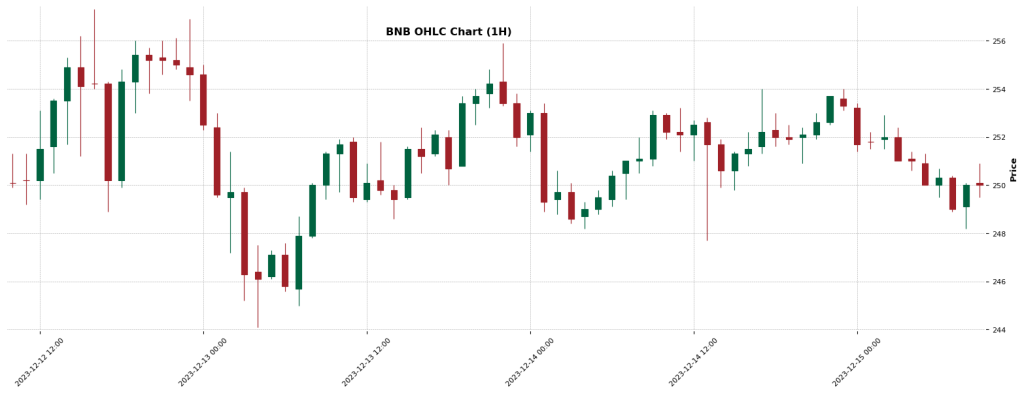
BNB’s ‘EMA: Bearish Crossover’ signal points to a potential decrease in value. With short-term support at $246 and resistance at $254, its profit potential stands at a modest 1.25%.
Backtest data:
Backtesting 144 signals shows a success rate of 56.25% and an average profit potential of 4%. Accordingly, it seems reasonable to additionally analyze further indicators and the entire market before placing a trade.
HOOK: Oversold Conditions Present Opportunities
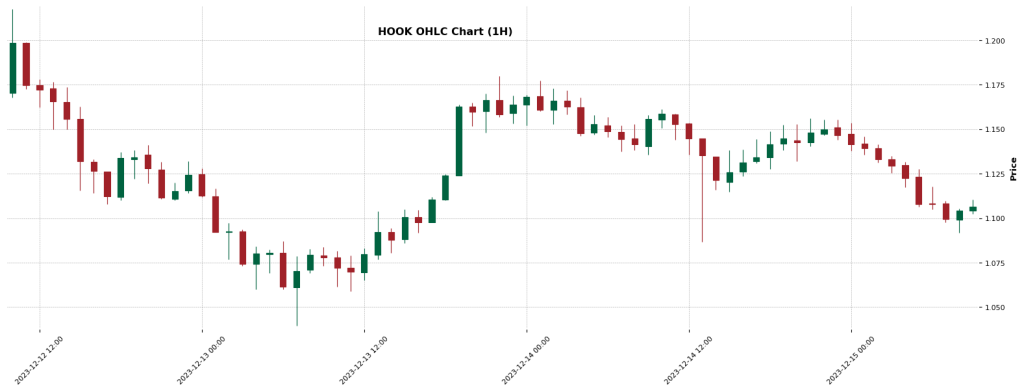
HOOK displays an ‘RSI: Oversold’ signal, suggesting a potential rebound. The support is at $1.06, and the resistance is at $1.15, offering a profit potential of 2.8%.
Backtest data:
Analyzing the historical data of HOOK brings us the following insights: Backtest data of 124 signals shows a 55.65% success rate of the RSI Oversold signal on the hourly chart. The average profit potential lies at 9.5% — which is quite interesting. However, due to the rather low success rate it seems reasonable to analyze further data before placing a bet.
STEEM: Short Opportunities Ahead
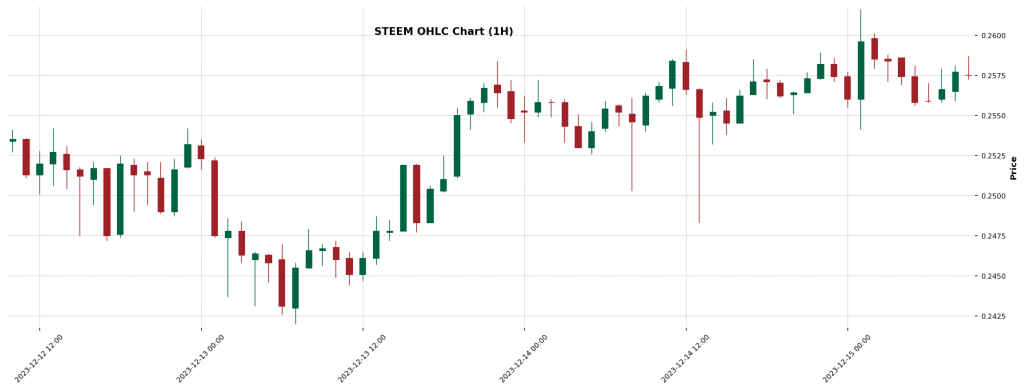
STEEM’s ‘Hyper Scalper: Short’ signal indicates a short-term downward trend. The Hyper Scalper strategy is specifically designed for short-term trades and use a combination of different EMA’s as well as the ADX for confirmation. The token has support at $0.25 and resistance at $0.2618, with a profit potential of 1.3%.
Backtest data:
The backtest shows a whopping success rate of 69.57% on 23 signals, along with an average profit potential of 1%.
Check out even more crypto signals:
Crypto Trading Signals — 14th December 2023 (LUNC, SAND, AGIX, and many more)
Crypto Trading Signals — 13th December 2023 (HBAR, ADA, HIVE, and many more)
Crypto Trading Signals — 12th December 2023 (BTC, DOT, ADA, DOGE, and more
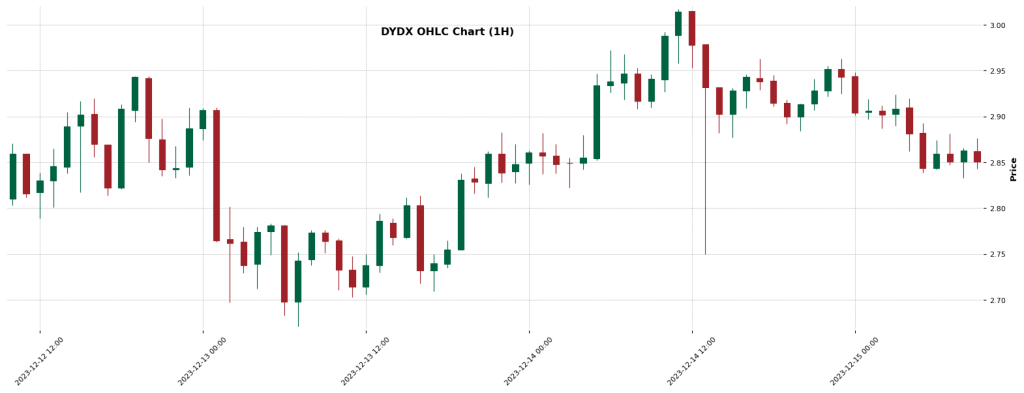
DYDX: Bearish Crossover in Focus
DYDX has triggered an ‘EMA: Bearish Crossover’ signal. With support at $2.77 and resistance at $2.95, its profit potential is 2%. Unfortunately, there’s no backtest data available for this trading signal/token combination.
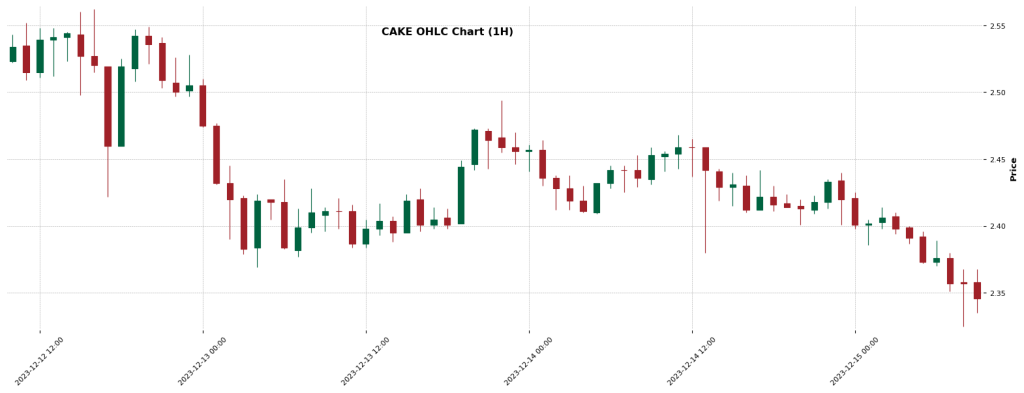
CAKE: Potential Rebound in Sight
CAKE presents an ‘RSI: Oversold’ signal, hinting at a possible uptrend. The token’s support level is at $2.308, and resistance is at $2.436, offering a profit potential of 1.8%
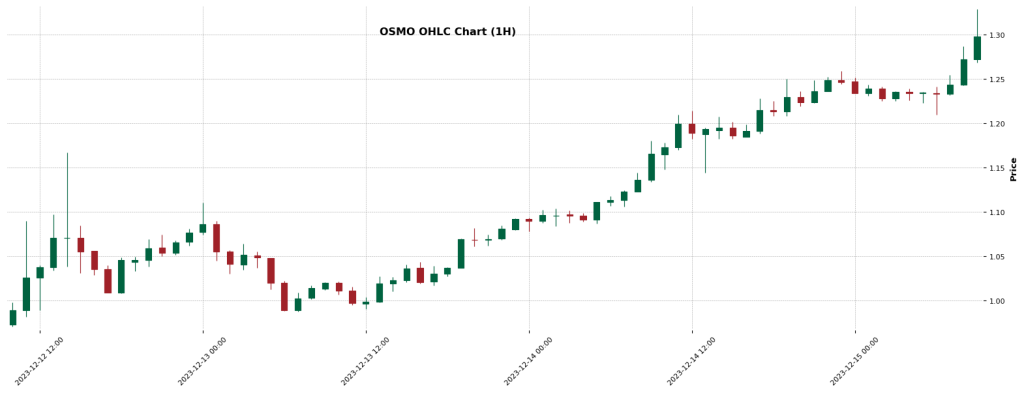
OSMO: Overbought Territory Calls for Caution
OSMO has an ‘RSI: Overbought’ signal, suggesting potential saturation. The support and resistance levels are at $1.18 and $1.30, respectively, with a profit potential of 3.8%.
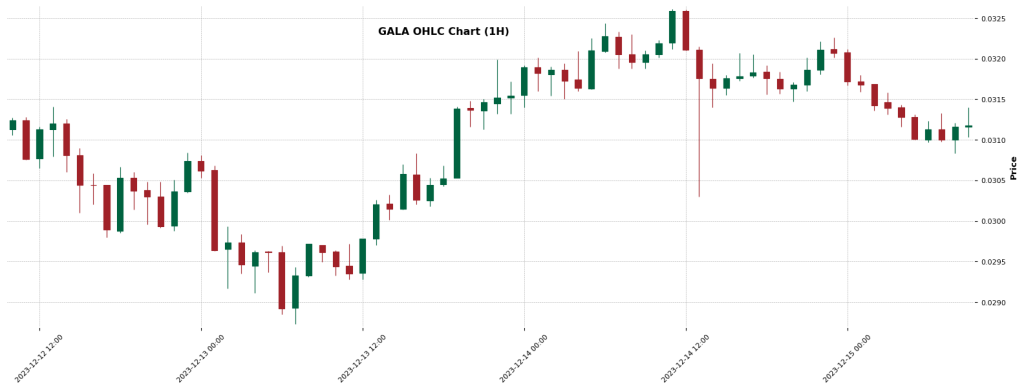
GALA: A Downward Trend on the Horizon
GALA shows an ‘EMA: Bearish Crossover’ signal. The token’s support is at $0.03, and resistance is at $0.0319933333, offering a profit potential of 1.96%. Without backtest data, careful market observation is necessary to validate this bearish outlook.
For more chart patterns, trading signals, and crypto data, download our app in the Appstore or Playstore: Download Now
In conclusion, the recent trading signals for these cryptocurrencies offer a mixed bag of bullish and bearish trends. Traders must consider these signals alongside current market conditions, technical indicators, and trading volumes. These indicators’ dynamic and sometimes contradictory nature underscores the importance of an adaptable and informed trading strategy in the cryptocurrency market. By staying attuned to these short-term signals and market dynamics, traders can better position themselves to capitalize on potential market movements.