In the intricate and multifaceted landscape of cryptocurrencies, Decentraland (MANA) emerges as a token of interest for investors seeking opportunities in virtual reality spaces. In this analysis, we meticulously dissect the current performance and future prospects of MANA, backed by a robust analysis of various technical indicators and price patterns. Let’s delve in and decipher what the statistics are illustrating about this burgeoning digital asset.
Price Analysis
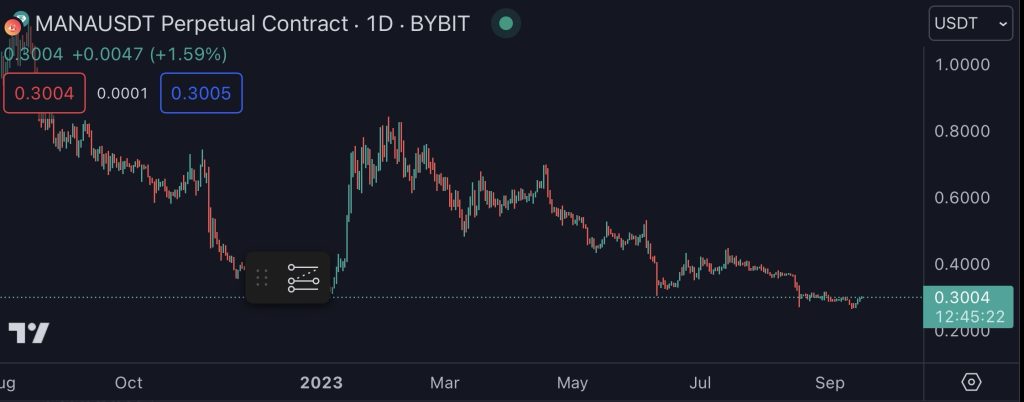
Decentraland (MANA) presently stands at a price of $0.301, observing a moderate rise of 3.60% in the last 24 hours.
While the recent upsurge offers a glimpse of positivity, a broader perspective reveals a mixed bag of developments.
Over the last week, the token has slightly receded by 1.42%, and the decline extends to a noticeable 21.8% on a 30-day scale. However, a beacon of hope arises when we consider the annual change, with MANA posting a modest growth of 2.99%.
Technical Indicators
Trend Indicators
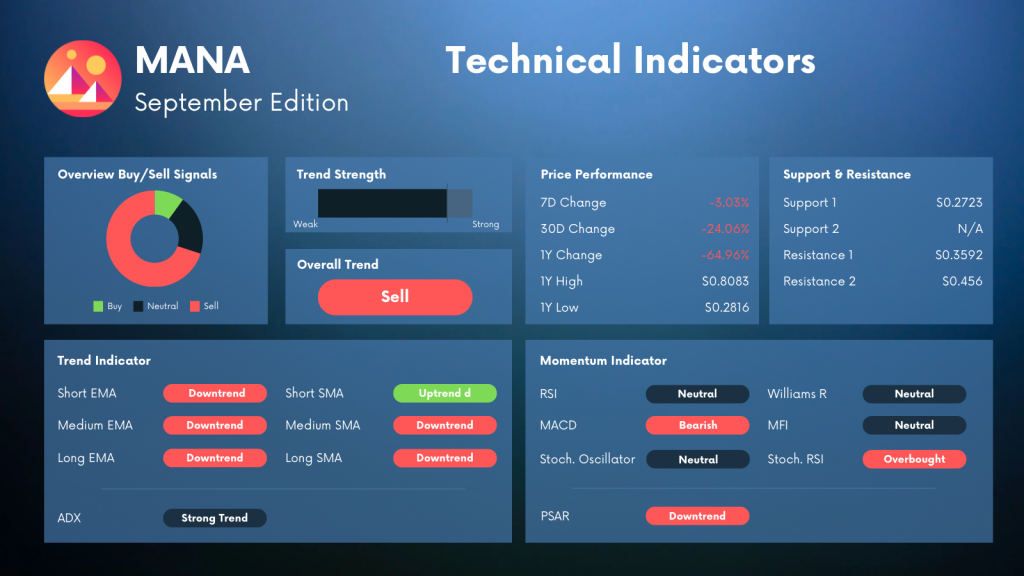
When we analyze the trend indicators, we note a light trend strength, which is indicative of a relatively stable market phase.
This light trend is echoed by the Average Directional Index (ADX). The overall trend for MANA is presently bearish, providing a somewhat negative landscape for investors.
A more granular look, however, presents a division in the trend analysis. While the short and medium-term EMAs, as well as the long-term SMA, show a downward trajectory, the short-term SMA signals an uptrend, offering a semblance of optimism amidst prevailing downtrends.
Momentum Indicators
Switching our focus to momentum indicators, we witness a series of neutral signals from the Relative Strength Index (RSI), Stochastic Oscillator, Williams %R, and the Money Flow Index (MFI).
These neutral standings suggest that the market is in a state of equilibrium, with no clear indications of an immediate upward or downward surge.
Contrastingly, the Moving Average Convergence Divergence (MACD) holds a bearish stance, hinting at possible downward pressure in the coming period. Moreover, the Stochastic RSI indicates an overbought situation, suggesting that a price correction might be on the horizon.
Trade Recommendation
Given the blend of indicators exhibiting both neutral and bearish signals, potential investors should approach with a strategy grounded in caution and diligence.
It might be advisable to maintain a balanced portfolio by possibly allocating a moderate portion to MANA, keeping an eye out for any significant shifts in market dynamics.
Furthermore, investors might find it beneficial to set up stop-loss measures to mitigate potential losses, given the overbought signal emanating from the Stochastic RSI.
About Decentraland
Decentraland represents a groundbreaking platform where users can traverse, purchase, and build upon virtual reality spaces, represented and governed by the MANA token. As a pioneer in virtual reality-based blockchain platforms, Decentraland offers a unique investment avenue, where cryptocurrency meets the boundless potential of virtual real estate and experiences.
Summary
To sum up, the Decentraland (MANA) token currently demonstrates a nuanced market behavior, characterized by a blend of neutral and downward trend indicators.
While recent price performance showcases a moderate uptick, the wider picture presents a cautious investment environment. As we traverse through this dynamic market landscape, a vigilant and adaptable approach could potentially yield fruitful results for prospective investors in the MANA landscape.