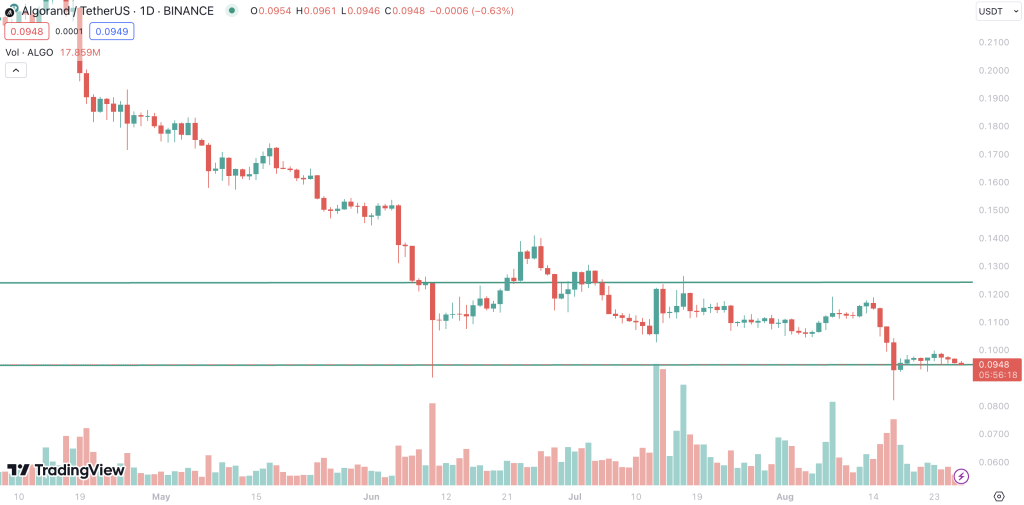
ALGO, a prominent player in the crypto space, currently trades at a modest $0.094. Over the past 24 hours, it has seen a gentle ascent, registering a 0.6% increase. This might seem meager at a glance, but delve deeper and an intriguing narrative unfolds. Trends indicate a transition, with the token hovering in a sideways trajectory of late. Often, this lateral movement serves as a precursor to a potential trend reversal.
Moreover, the recent surpassing of the downtrend line (visibly depicted as a blue line on charts) sends out optimistic signals about ALGO’s near future. While swing traders could consider the $0.09 support as a viable entry point, it’s imperative to tread cautiously. This could be classified as a high-risk setup, predominantly due to the overarching downward trend. For trend traders waiting for a stronger bullish signal, the key price point to watch is $0.14 – the value at which ALGO would need to break to establish a higher high and signal an optimistic trend reversal.
Technical Indicators: Dissecting ALGO’s Intricacies
Diving into the technical indicators:
- Moving Averages: The moving average trends depict a consistent story across short-, medium-, and long-term outlooks. All of these perspectives point towards a downtrend. These SMA readings suggest that ALGO, in its recent past, has consistently traded below its average prices, signifying bearish sentiment.
- RSI: ALGO’s Relative Strength Index (RSI) currently rests in the neutral zone. This means neither overbought nor oversold pressures dominate, making it tricky to predict immediate market movements.
- MACD: With a bearish stance on the Moving Average Convergence Divergence (MACD), the shorter-term moving average is below the longer-term average, often interpreted as a selling signal.
- Oscillator: Further affirming the bearish sentiment, the oscillator paints a picture of caution for potential investors.
- ADX: The Average Directional Index (ADX) stands weak, suggesting that the strength of the current trend, whether bullish or bearish, is feeble.
Trade Setup & Outlook: The ALGO Forecast
Given the confluence of the above indicators and the potential break of the downtrend line, the short term paints an interesting picture for ALGO. While the overall trend still remains downward, the recent sideways movement coupled with the neutral RSI might suggest a potential consolidation or buildup phase. If ALGO sustains above the $0.09 support, this could set the stage for an attempt to push beyond its immediate resistance.
The defining moment, however, remains the $0.14 threshold. A successful surpassing of this mark could firmly indicate a trend reversal and propel ALGO into a bullish domain.
About ALGO: A Glimpse into Its Essence
Algorand (ALGO) is more than just another cryptocurrency; it’s a decentralized platform that aims to enable a borderless economy. Built on a purely proof-of-stake foundation, it boasts of instant transaction finality and true digital representation of assets. Its core essence is to solve the blockchain trilemma, ensuring scalability, security, and decentralization coexist seamlessly.
Piecing Together ALGO’s Current Landscape
Navigating the labyrinthine world of cryptocurrency, ALGO emerges with potential signs of a pivot. While its current price and overarching downtrend might give investors pause, its recent break from the downtrend line and technical indicators suggest a complex tapestry.
A potential short-term bullish opportunity might be brewing, but trend traders should eye the $0.14 mark for clearer signals. In essence, ALGO stands at a crossroads, and its next moves will be pivotal in determining its trajectory in the crypto arena.