Today’s spotlight is on Elrond (EGLD), a token that has been turning heads for some time now. If you want to make your next move in the crypto market, you’ll want to stick around for this one.
We have intriguing data suggesting an 18% drop in EGLD’s price, courtesy of an overbought RSI and our AI analysis. Here’s why this is a moment you can’t afford to miss.
Overbought RSI: A Precursor to Change?
EGLD can look back at an impressive performance during the last days and weeks. Consequently, the RSI entered overbought territories on the daily chart. Although this is quite logical, the historical data for EGLD holds some interesting insights.
Therefore, we’ve crunched the numbers for the last two years. Here’s the intriguing result: Trading the overbought RSI signal on the daily chart leads to a success rate of more than 90% in terms of EGLD. On average, the best result was achieved after five days with a price decline of 18%.
Given the consistency of this metric, it’s a warning sign that should not be taken lightly.
→ Discover the CryptoKnowledge iOS app for more details & data
A Symphony of Technical Indicators and AI
To offer a more holistic view, let’s look at other technical indicators alongside our AI insights.
Price Performance Metrics
The past seven days have seen EGLD rise by 3.27%, while the 30-day change is a more robust 16.86%. Despite the short-term upward movements, the asset has declined by 48.11% over the past year. This dichotomy suggests that while EGLD has seen some resurgence lately, its long-term stability remains questionable.
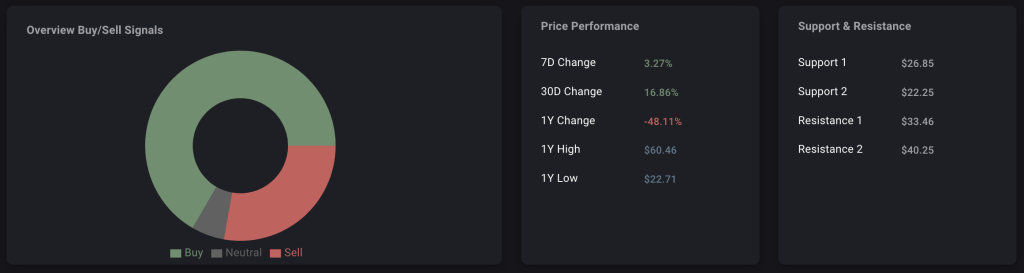
Support and Resistance
Current support levels are at $26.85 and $22.25, while resistance hovers around $33.46 and $40.25. These figures provide essential landmarks traders can use to set entry and exit points. Should the price dip to around the first support level or even the second, it could offer a ripe buying opportunity, especially for long-term investors.
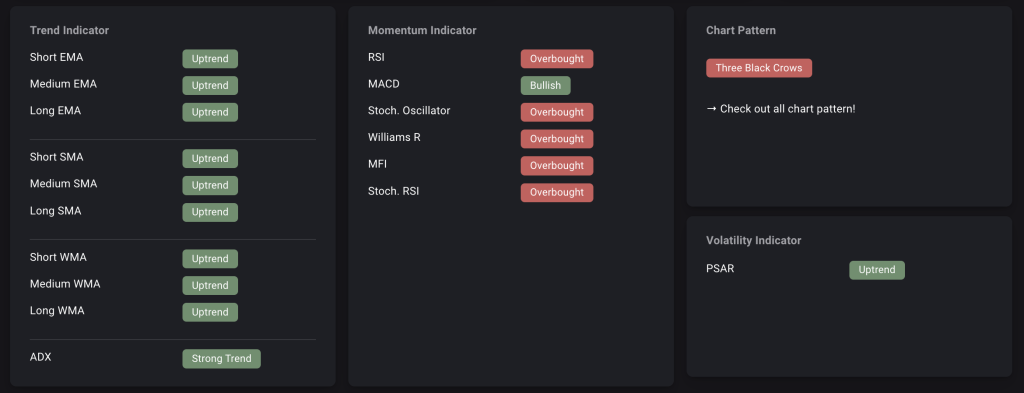
Trend Indicators
The EMAs, SMAs, and WMAs point upward, which typically signals bullish momentum. Similarly, the ADX indicates a strong trend, and MACD is bullish. These indicators, generally used to confirm a trend, create a contrasting backdrop to our overbought RSI and AI forecasts, adding complexity to the current situation.
Overbought Landscape
In addition to RSI, other overbought indicators like the Stochastic Oscillator, Williams R, MFI, and Stochastic RSI also affirm that EGLD may be overvalued at the moment, lending further credence to the argument for a downward price correction.
AI’s In-Depth Forecast
Our AI’s analysis of the past two years of EGLD price data reveals a strong correlation of 0.963 with the current trends. In layman’s terms, the current situation closely resembles seven instances in the past, all of which led to a roughly 13% price decline within the following week.
This could translate to EGLD’s value plummeting to around $26.42 in the next seven days.
The Ideal Strategy: What’s Next?
So here’s the big question: How should you maneuver through this labyrinth of bullish and bearish signals?
- For Traders: The overwhelmingly bearish forecast from both our AI and RSI suggests this could be a golden opportunity for a short position. Remember, these aren’t mere speculations; data and historical performance back them.
- For Long-term Investors: The projected decline could be an excellent entry point. If EGLD’s value does drop to the predicted levels, it might be a good time to accumulate more tokens for the long haul.
Wrapping Up
In the end, both our advanced AI algorithms and the tried-and-true RSI indicator are singing in harmony, predicting an 18% price drop for EGLD. Such consensus among diverse analytical tools is rare, making it a compelling case for potential market action.
Always remember, the best traders are not just guided by intuition but also by meticulous research and calculated risks. So, until next time, may your portfolio grow and your risks stay low.
Your Next Step(s)
→ Check out the CryptoKnowledge iOS app for more details & data
→ Start trading EGLD