The EMA is a kind of moving average that emphasizes the most recent price movements, allowing it to respond faster to market changes than the Simple Moving Average (SMA). It’s essential in capturing short-term market sentiments, making it particularly relevant for cryptocurrency trading.
Basics of EMA Calculation
At its core, calculating the EMA involves taking a certain number of the most recent price points, such as the last 20 days. From these, an average is derived. However, instead of treating every day equally, more emphasis is placed on the recent days. This means that if there’s a sudden price jump today, it will have a more pronounced effect on the EMA than a price change that happened many days ago. This weighted approach is why the indicator is more responsive to new data and changes in price.
Key Points to Remember
- Sensitivity: EMA is more reactive to new data, primarily because it prioritizes recent price movements. This feature allows traders to catch early signals of potential market shifts.
- Various Lengths: Traders employ EMAs of different durations, like 10-day, 50-day, or 200-day, to gauge both short-term and long-term market sentiments. These varied lengths help traders capture the full spectrum of market movements.
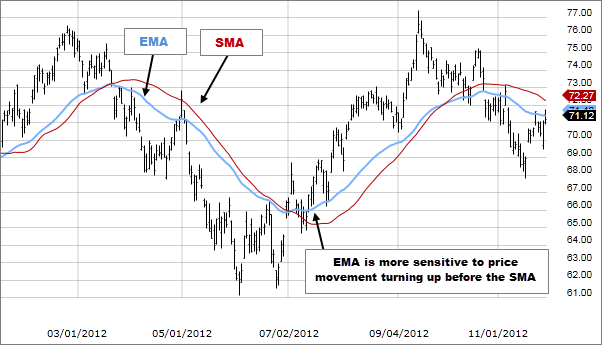
- Comparison with SMA: The primary distinction between the EMA and the SMA lies in their sensitivity to price changes. Due to its emphasis on recent data, the indicator adjusts more promptly to price modifications, making it a favored tool among many traders.
Real-World Application of EMA
In the realm of financial trading, the EMA offers traders a dynamic lens through which they can observe and interpret market trends. Given its emphasis on recent price data, the EMA serves as an agile indicator, making it a favorite among many traders, especially in volatile markets.
- Short-term Trading Decisions
Day traders and swing traders often utilize the EMA to detect short-term price momentum. By observing how the current price interacts with the EMA, they can get cues on potential entry or exit points. For instance, when the price of an asset crosses above its EMA, it might be seen as a bullish signal, suggesting a potential upward move.
- Support and Resistance Levels
EMAs can act as dynamic support and resistance levels. In a rising market, it might serve as a support level, where the price tends to bounce off. Conversely, in a declining market, it might act as a resistance level, preventing the price from rising above it.
- Trend Confirmation
EMA can also be used in tandem with other moving averages to confirm market trends. A common strategy involves using two EMAs, one short-term and one long-term. When the short-term EMA crosses above the long-term EMA, it’s typically seen as a confirmation of an upward trend, and vice versa.
EMA in Crypto Trading
Given the volatility inherent in cryptocurrencies, a tool like EMA becomes invaluable. The indicator’s sensitivity to recent price changes allows traders to make timely decisions, especially in a market known for its abrupt price shifts.
Collaborative Analysis
EMA, when used alongside other indicators such as the Moving Average Convergence Divergence (MACD) or the Percentage Price Oscillator (PPO), can offer more comprehensive insights. For instance, a strong upward trend indicated by the EMA, coupled with supportive readings from other indicators, can bolster a trader’s confidence in their market strategy.
Limitations and Considerations
EMA’s emphasis on recent data can sometimes be a double-edged sword. Quick price spikes might disproportionately influence the indicator, potentially leading to misleading signals. While many traders believe that newer data better represents a security’s current trend, there’s also a perspective that giving excessive weight to recent dates might result in biases, leading to possible false alarms.
Moreover, relying solely on past data, as the indicator does, can be limiting. It’s essential to remember that while historical data provides context, markets, especially ones as efficient as cryptocurrency markets, are influenced by a myriad of ever-evolving factors.
Conclusion
In conclusion, the Exponential Moving Average (EMA) stands as an indispensable tool for traders and investors alike. By emphasizing recent data points, it offers a dynamic perspective on price trends, allowing individuals to make informed decisions in ever-shifting markets. Whether used alone or in combination with other indicators, the EMA provides valuable insights into market momentum, helping traders navigate the complexities of financial landscapes with confidence.
Navigate the Crypto Seas with CryptoKnowledge
With an in-depth understanding of the Exponential Moving Average, you are poised to tackle the challenges of the cryptocurrency market on the CryptoKnowledge platform. We strive to empower traders with the tools and insights vital for informed decision-making in the ever-evolving crypto landscape. Here’s to charting your course with CryptoKnowledge, where expertise translates to success!