Ethereum (ETH) — Current Status
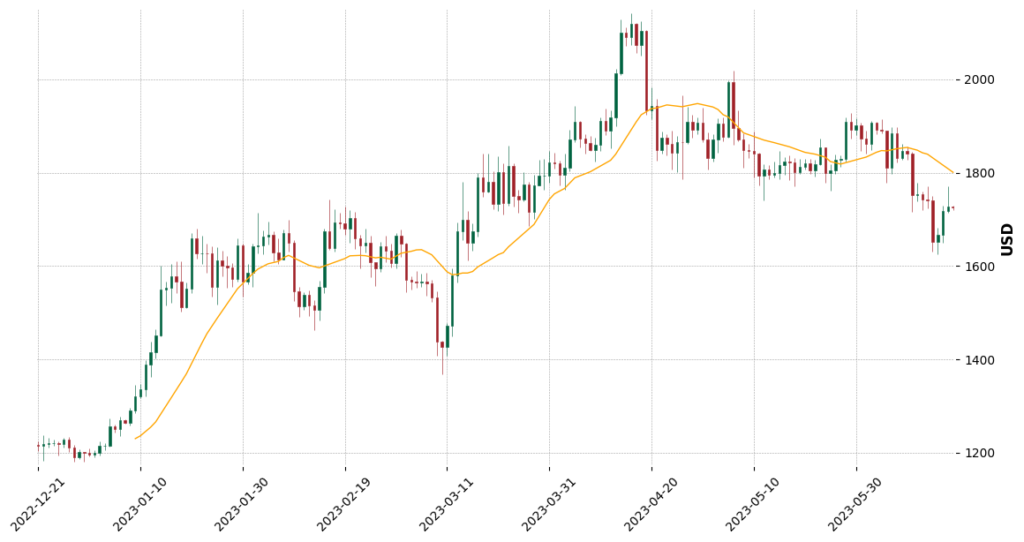
Ethereum, the world’s second-largest cryptocurrency by market capitalization, currently sits at a trading price of $1,729, marking a minute change of 0.06% over the past 24 hours. In terms of trade setup, Ethereum maintains an uptrend in the long term despite its recent bearish breakout from the Descending Triangle pattern. This is marked by a break below the $1,700 support level.
The crypto giant has now hit the 200-day moving average (approximately $1,630) and a long-term upward trendline that could serve as a robust support area. The momentum seems to be inflecting bullish, as indicated by the rising MACD Histogram bars, possibly forecasting a short-term bounce. Setting a price alert for this scenario could be beneficial.
In terms of Support and Resistance Zones, Ethereum finds its nearest Support Zone at $1,700, followed by $1,400. Conversely, the immediate Resistance Zone is $1,800 (previous support), with subsequent zones at $2,000 and $2,150.
Ethereum (ETH) — Technical Indicators
A comprehensive understanding of Ethereum’s market health can be attained by examining several key technical indicators. The short and medium-term trends based on the Simple Moving Average (SMA) indicate a downtrend, whereas the long-term SMA suggests an uptrend, underscoring the current complex market dynamics.
The Relative Strength Index (RSI) for Ethereum presents a neutral stance, indicating a balance between buying and selling pressures. The Moving Average Convergence Divergence (MACD), typically used to identify possible buy and sell points, currently leans towards a bearish phase, suggesting caution for traders.
Interestingly, the Oscillator, another momentum indicator, shows a bullish signal, pointing towards potential buying opportunities in the near term. Finally, the Average Directional Index (ADX) presents a weak trend strength, suggesting that the current market trend isn’t very strong—whether up or down.

Ethereum (ETH) — Trade Setup & Outlook
Given the mixed signals from technical indicators, Ethereum’s price trajectory seems to be at a critical juncture. The recent break below the $1,700 support level following a bearish breakout from a Descending Triangle pattern adds a note of caution for traders. However, the neutral RSI and the bullish Oscillator indicate that Ethereum may be on the verge of a short-term bounce back, especially as it hovers near the 200-day moving average and the long-term upward trendline.
The weak ADX suggests the current trend isn’t strong, which, combined with a bearish MACD, implies Ethereum could experience sideways movement before determining its next major move. Traders should monitor these evolving dynamics and consider setting price alerts to stay informed.
About Ethereum
Ethereum (ETH) is more than just a cryptocurrency; it’s a decentralized, open-source, blockchain-based platform that enables developers to build and deploy smart contracts and decentralized applications (dApps). The platform’s native token, Ether, fuels these operations, facilitating transactions and incentivizing miners to secure the network.
Since its launch in 2015, Ethereum has revolutionized the blockchain space, providing a blueprint for numerous other projects and emerging as the foundation for the booming DeFi (Decentralized Finance) and NFT (Non-Fungible Token) sectors.
Summary – Deciphering Ethereum’s Course
Ethereum navigates through mixed signals from key technical indicators, reflecting a market in flux. Although short and medium-term trends show a downturn, the long-term view remains optimistic. Meanwhile, the bearish MACD counters a bullish Oscillator, and a weak ADX indicates a lack of a strong trend.
Ethereum’s fundamental position within the cryptocurrency ecosystem remains robust despite the challenges. Its ability to support programmable money through smart contracts and dApps continues to cement its position as a leading player in the crypto world. Traders and investors would do well to monitor Ethereum’s trajectory closely in the face of these complex market conditions.