In the dynamic world of cryptocurrency trading, every trend, pattern, and indicator is a potential beacon to guide investors toward profitable opportunities. With its ever-evolving nature, the Ethereum (ETH) market is no exception.
As it now trades within a promising Bullish Flag pattern, ETH stands at a significant juncture. This post will delve into our comprehensive technical analysis of Ethereum, illuminating the current status, potential trade setup, and giving an insightful perspective into this crypto giant.
About Ethereum (ETH)
Ethereum, conceptualized by Vitalik Buterin and launched in 2015, operates as an open-source, blockchain-based platform that enables developers to build and deploy decentralized applications (dApps). Its native cryptocurrency, Ether (ETH), functions as a digital currency like Bitcoin and powers these dApps through its unique “gas” mechanism. Ethereum’s innovative smart contract capability has proven to be a game-changer, cementing its position as the second-largest cryptocurrency by market capitalization.
Current Status and Indicators
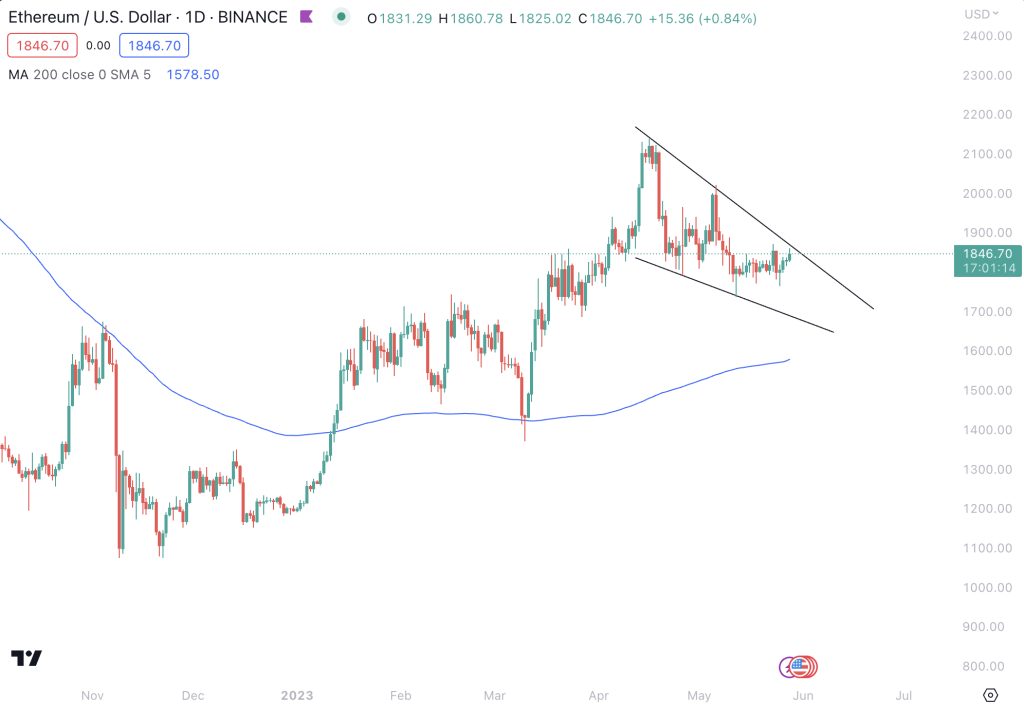
Ethereum is consolidating in a Bullish Flag pattern after a sharp run-up to $2,150. Such a pattern signifies a continuation, typically resolving in a bullish breakout aligning with the existing uptrend. For the uninitiated, a Bullish Flag pattern is a short-term, small rectangle trading range moving counter to the prevailing price trend on a longer time frame chart. Following a sharp advance, it often signals a slight change in direction or areas of consolidation before the previous trend resumes.
Traders highly favor this pattern due to its reliable tendency to provide a setup for entering an existing trend on the brink of continuation. Trade is typically initiated on a breakout if it aligns with the prevailing trend. With bullish flag patterns, traders often prefer a breakout accompanied by an increase in volume, although this isn’t a strict requirement.
When we look at Ethereum’s broader trend status, it’s neutral on a medium-term basis and trending upwards on both short- and long-term timeframes. Ethereum’s momentum appears mixed as the MACD (Moving Average Convergence Divergence) Line is above the MACD Signal Line, suggesting a bullish outlook. However, a neutral RSI (Relative Strength Index) of around 50 offsets this, hinting at potential equilibrium between buyers and sellers.
Ethereum’s nearest Support Zone is $1,800 on the support and resistance front, followed by $1,700 and $1,400. Conversely, the immediate Resistance Zone is at $2,000 (which was a previous support), trailed by $2,150.
Ethereum — Trade Setup
Considering the prevailing Bullish Flag pattern, our trade setup for Ethereum is as follows: After peaking at $2,150, the price was overbought (with an RSI above 70), leading traders to secure profits and prompting the liquidation of leveraged long positions. This process brought about a consolidation phase, now observable as the current Bullish Flag pattern.
As this pattern typically signals a continuation, we anticipate a bullish breakout to align with the existing uptrend. To capitalize on this potential price movement, consider setting a price alert to stay ahead of the curve. Remember, the ideal scenario for trading this bullish flag pattern is a breakout with an increase in volume.
Trading the ETH Bull Flag — Additional Thoughts
In summary, Ethereum stands at a crucial crossroads, trading within a promising Bullish Flag pattern. Although the RSI is neutral, and MACD suggests bullish momentum, traders should tread carefully and consider the defined Support and Resistance Zones. As ever, due diligence, cautious optimism, and timely action remain the keys to unlocking Ethereum’s potential in these fluctuating market conditions.
While ETH’s immediate future may seem uncertain due to mixed signals from various indicators, its long-term uptrend and the prevailing Bullish Flag pattern present potential opportunities for both trend and swing traders. The target for a potential upward breakout is around $2,150, which aligns with the previous resistance, and the key support level to watch out for is $1,800.
In conclusion, Ethereum, one of the leading names in the crypto space, continues to provide intriguing opportunities for traders and investors. Despite the current mixed signals from different indicators, its potential to continue its long-term uptrend and break out of the Bullish Flag pattern may present fruitful opportunities for those ready to take advantage. As always, the key to successful trading lies not only in thorough analysis but also in disciplined execution and prudent risk management.
Investing in cryptocurrencies carries risk; make decisions within your risk tolerance. Remember that the above analysis is based on technical indicators and patterns, and it’s always recommended to consider multiple analysis methods, including fundamental analysis and news events when trading or investing.