Ethereum (ETH), the second-largest cryptocurrency by market capitalization, has consistently garnered the attention of traders and investors. Ethereum’s decentralized, open-source blockchain boasting smart contract functionality has not only spurred on the advent of the Decentralized Finance (DeFi) and Non-Fungible Tokens (NFT) ecosystems but also paved the way for various technical trading strategies.
In this article, we delve into the current state of Ethereum’s technical analysis, evaluating its trend status, momentum, and crucial support and resistance zones. We also propose potential trade setups based on recent price action.
About Ethereum (ETH)
Launched in 2015, Ethereum, often dubbed the “world’s programmable blockchain,” presents a broad range of use cases extending beyond the mere transfer of value.
Its native cryptocurrency, Ether (ETH), is used to power applications built on the Ethereum blockchain, execute smart contracts, and, most importantly, incentivize network participants to secure the network and validate transactions.
Given its multifaceted functionality and growing ecosystem, Ethereum has become an appealing prospect for traders, reflected in its dynamic price action.
Current Status and Indicators
Ethereum is currently trading at around $1900. An analysis of the Simple Moving Averages (SMA) and Exponential Moving Averages (EMA) across all time horizons (short, medium, and long-term) suggests a robust uptrend for Ethereum. This indicates strong bullish momentum and a potential for higher price levels if this trend persists.
From a momentum perspective, Ethereum presents a bullish scenario. The Moving Average Convergence Divergence (MACD) line is above the MACD signal line, often interpreted as bullish. Furthermore, the Relative Strength Index (RSI) is above 55, signifying strong buying momentum and reinforcing the bullish outlook.
Regarding support and resistance, the nearest support zones lie at $1800, followed by $1700 and $1400. These are crucial price points that have historically shown strong buying interest, which could potentially cushion any downward price movements. Conversely, the immediate resistance zone is at $2000, a previously supported level. This is followed by a higher resistance level at $2150, suggesting potential targets for Ethereum if the bullish momentum continues.
Trade Setup
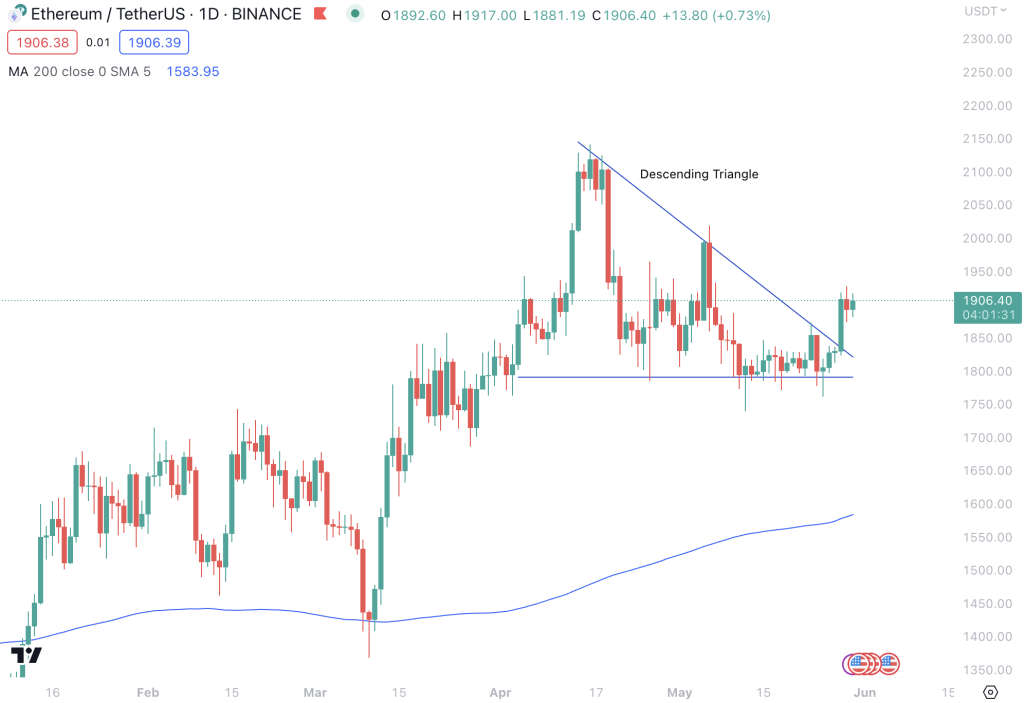
The recent price action of Ethereum offers intriguing trade setups. After reaching $2150 on a sharp run-up, the price was overbought with RSI > 70, signaling potentially unsustainable bullish momentum. As a result, traders began to take profits, leading to a price consolidation in a Descending Triangle pattern.
This Descending Triangle pattern has now been broken to the upside in line with the existing uptrend. The price break above this pattern could suggest renewed bullish momentum and set the stage for a potential revisit to the $2K resistance level.
Upon a decisive break above the $2K resistance level, a run-up to the $2150 resistance level is likely. Traders must monitor the volume during this potential breakout, as the increased volume could indicate strong buyer interest and the potential for further upward price movement.
Summary
In summary, Ethereum’s current technical outlook presents an intriguing trading landscape, with clear uptrends, bullish momentum, and potential bullish breakout from a Descending Triangle pattern. While the resistance at $2K presents a near-term hurdle, a breakout above this level could open the doors for a test of the $2150 level.
As always, it’s vital to keep an eye on the broader market conditions, adjust risk management strategies accordingly, and stay flexible to the ever.