Current Status: HBAR Primed for Bullish Reversal?
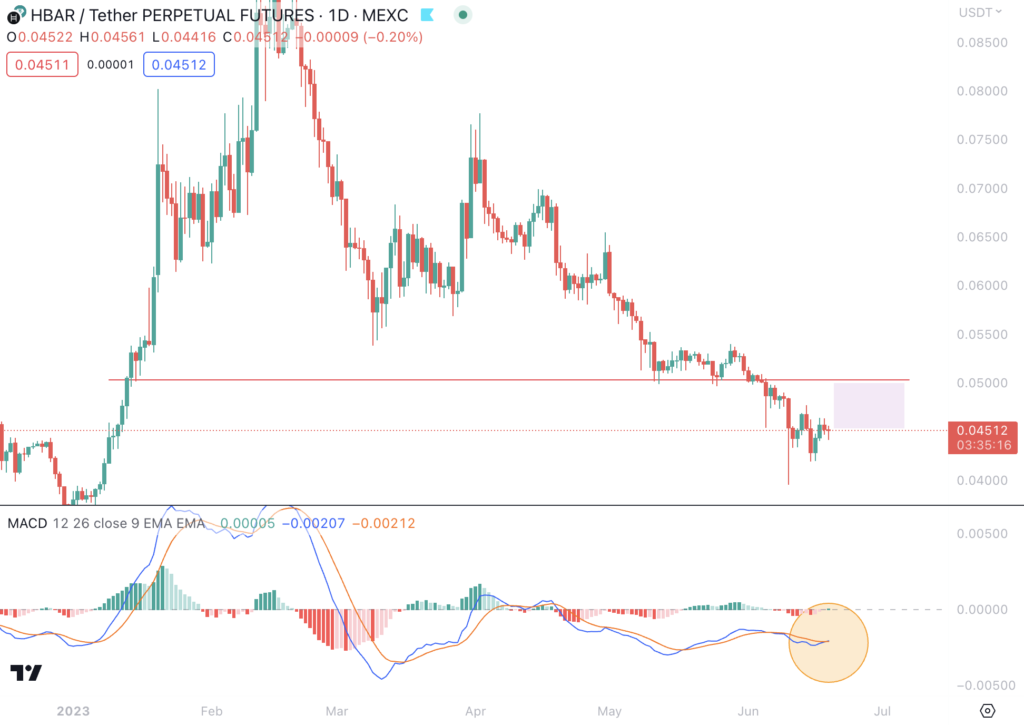
Hedera Hashgraph’s native token, HBAR, currently trades at $0.045, marking a slight dip of -0.2% over the past 24 hours. While this nominal decrease might discourage casual observers, deeper analysis tells a different story. HBAR’s MACD (Moving Average Convergence Divergence) recently flashed a bullish crossover, hinting at a potential upward price movement in the near term.
The token’s next resistance level is added to the bullish narrative, which sits at $0.05. Should HBAR break past this resistance, investors could see more than 10% upside potential. However, as always, such potential must be weighed against various technical indicators, a factor we will discuss in the following section.
Technical Indicators: A Deeper Dive into HBAR’s Market Signals
To thoroughly understand HBAR’s future prospects, we need to scrutinize its technical indicators. Let’s look at some key elements:
- Trends based on moving averages: Presently, HBAR displays a short, medium, and long-term downtrend based on its Simple Moving Averages (SMAs). These trends indicate a bearish momentum in the past, which suggests that the token has been under selling pressure.
- RSI: The Relative Strength Index (RSI) for HBAR currently reads ‘Neutral.’ This suggests the token isn’t oversold or overbought, providing room for potential price movements in either direction.
- MACD: Despite the bearish trends indicated by the SMAs, HBAR’s MACD points towards bullish momentum. This indicator could hint at a potential trend reversal in the making.
- Oscillator: Echoing the MACD’s sentiment, HBAR’s Oscillator is also bullish. Oscillators can be useful in identifying potential turning points in price movements.
Trade Setup & Outlook: Optimism Ahead for HBAR?
Given the technical indicators, the short-term outlook for HBAR is cautiously optimistic. The bullish signals from the MACD and Oscillator suggest a potential trend reversal despite the current downtrend signified by the moving averages.
While the SMA trends reflect a bearish sentiment, they’re based on past price data, and the recent bullish indicators might be pointing to a change in momentum. If HBAR breaks past its next resistance level at $0.05, this would confirm the bullish trend, potentially sparking a rally.
About HBAR: The Utility Token of Hedera Hashgraph
HBAR is the native cryptocurrency of the Hedera Hashgraph platform, a distributed ledger technology designed to be faster, more secure, and more efficient than traditional blockchain systems. HBAR serves multiple purposes within the Hedera network, including network protection against malicious actors, transaction fees, and enabling the operation of decentralized applications.
HBAR’s Bullish Possibilities
While HBAR currently shows a short-term downtrend, recent bullish signals from the MACD and Oscillator suggest a potential reversal. Should HBAR successfully breach the resistance level at $0.05, we could witness an upside of more than 10%.
However, as with all investments, these indicators should serve as guidance, not as definitive predictors. While the technical analysis provides a bullish outlook, factors such as market sentiment and overall crypto market performance should also be considered. As always, it is crucial for investors to do their due diligence and factor in their risk tolerance before making investment decisions.