In the dynamic and often unpredictable world of cryptocurrencies, staying updated and understanding market trends becomes pivotal. This comprehensive analysis takes you on a deep dive into the current market performance of The Graph (GRT).
From its current trading status to its intricate technical indicators, and from a keenly crafted trade setup & outlook to an informative introduction about the token, we’ve got it all covered. We aim to offer a balanced perspective by weaving the fine threads of data, trends, and expert insights into a coherent narrative. Whether you’re a seasoned trader, an occasional investor, or just crypto-curious, this detailed exploration of GRT’s potential market reversal promises a wealth of insights.
Prepare to delve deep into the story that numbers tell and gain a better understanding of GRT’s current market position and potential future direction.
Market Pulse: The Now of GRT
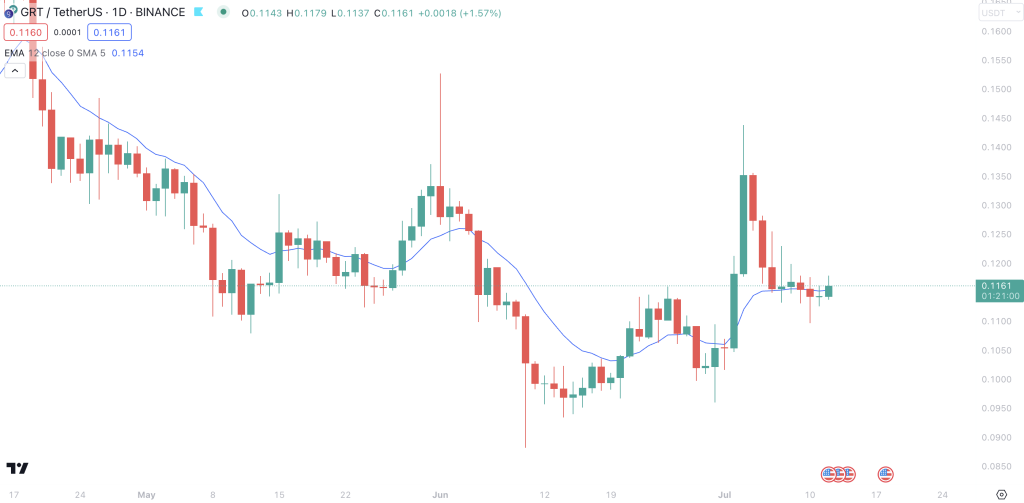
The Graph (GRT) currently trades at a humble $0.116, registering a modest price hike of 1.44% in the last 24 hours. From an observer’s perspective, this might not seem particularly exciting, but for those versed in the language of technical analysis, the current market behavior suggests a potential reversal in trend.
Post a bearish breakout from a Descending Triangle pattern, the price of GRT dipped to a low of $0.09. However, in a twist, the price managed to rebound above the 200-day moving average ($0.12), which in the world of cryptocurrencies could very well signal a reversal of trend. With this change, the possibility of the price revisiting $0.18 has started to resonate among traders.
Decoding the Signs: Unraveling GRT’s Technical Indicators
When analyzing GRT’s current market status, trends based on the Simple Moving Average (SMA) reveal a short, medium, and long-term downtrend. This suggests the crypto has been undergoing a prolonged period of bearish activity.
The Relative Strength Index (RSI) is neutral, indicating a balance between buying and selling pressures in the market. This does not favor either the bulls or bears, creating a sort of ‘wait and see’ scenario for the traders.
In contrast, the Moving Average Convergence Divergence (MACD), a trend-following momentum indicator, displays a bearish trend. This signifies that negative momentum might be expected in the short term.
The Oscillator, however, paints a bullish picture, which hints at a potential upward price movement in the near future.
Finally, the Average Directional Index (ADX), which measures the strength of a trend, is currently weak. This suggests that the prevailing trend, be it bullish or bearish, is not very potent, thus hinting at the potential for a trend reversal.
GRT’s Potential Path: Projecting Near-term Price Movements
Despite the bearish indications from the MACD and the weak ADX, the recent price action suggests an upward price movement could be on the horizon. The price breaking above the 200-day moving average is a positive sign, and the bullish Oscillator adds weight to this possibility. Traders should keep an eye out for confirmation of a trend reversal.
A successful push above the 200-day moving average could potentially attract additional buying pressure, increasing the likelihood of the price revisiting the $0.18 mark. However, traders should be cautious given the overall bearish trend and weak trend strength.
Unearthing the Foundations: Getting to Know GRT
GRT, or The Graph, is the backbone for decentralized finance (DeFi) and the broader Web3 ecosystem. Acting as a decentralized indexing and query layer, GRT allows developers to efficiently access blockchain data efficiently, fostering seamless interaction between decentralized apps (dApps) and underlying blockchains. Its token, GRT, is used to incentivize network participants, maintain protocol security, and govern the protocol’s future development.
Stepping Back: Summarizing GRT’s Market Performance and Prospects
In conclusion, while GRT currently exhibits a downturn trend over short, medium, and long-term periods, recent market activities suggest a potential trend reversal. A rebound above the 200-day moving average, alongside a bullish Oscillator, points towards the possibility of an upward price movement.
However, bearish signals from the MACD, coupled with a weak ADX, hint at potential obstacles on the way. This implies a cautious approach is advisable for traders, who should keep an eye out for any confirmations of a trend reversal.
Through its token GRT, the Graph continues to play a pivotal role in the DeFi and Web3 space. Despite the volatility, the unique fundamentals of the token continue to draw investor interest. As always, traders should balance technical indicators with these broader market fundamentals when deciding their next move.