The crypto space can be a roller coaster, and Harmony (ONE) seems to be amid a significant downturn. The digital asset has lost a substantial chunk of its value in the past month, and various indicators suggest that this trend might continue. So let’s dive into the details to ascertain the future prospects of ONE.
About Harmony (ONE)
Harmony (ONE) is a blockchain platform designed to facilitate the creation and use of decentralized applications (DApps). Its infrastructure introduces innovations like sharding and peer-to-peer networking to ensure high-speed and low-cost transactions. Unfortunately, despite its promising technology, ONE has been unable to escape the bearish momentum sweeping across the crypto market.
Harmony (ONE) — Current Status
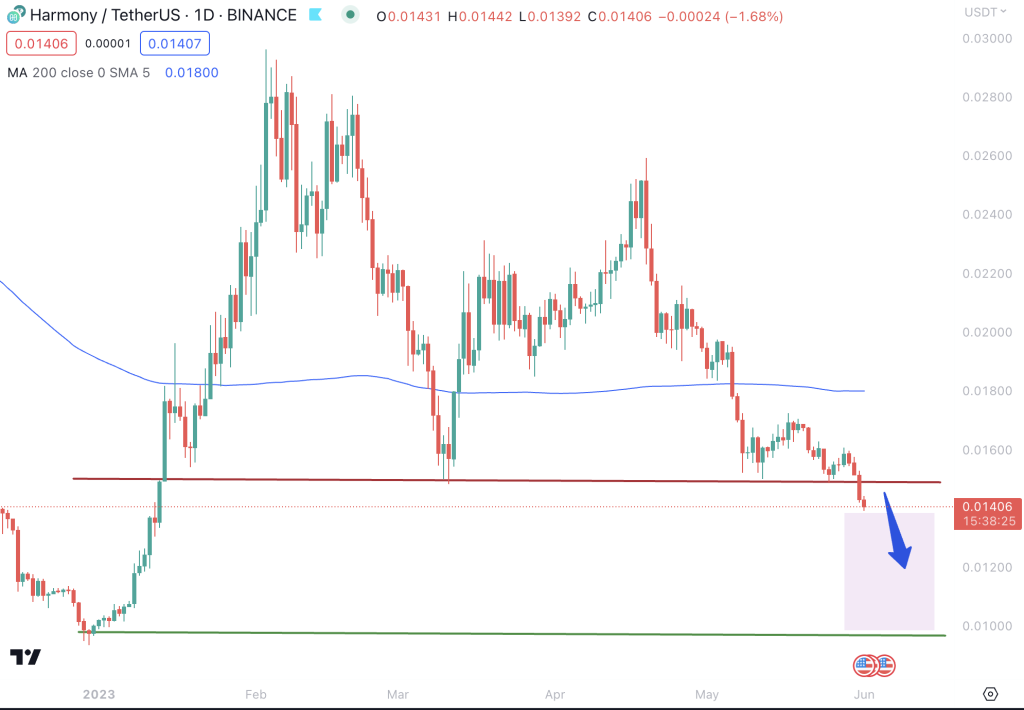
Currently, Harmony trades at $0.014, a figure that’s already more than 40% lower than its position 30 days ago. Additionally, a recent breach of its support level at $0.015 is a cause for concern. Given this break, a potential bearish price movement forecast could lead ONE down to the $0.010 mark, a further decline of approximately 30% in the coming weeks.
Indicators and Assessment
SMA & EMA
A raft of technical indicators reinforces the bearish narrative for Harmony. First, the Simple Moving Average (SMA) and Exponential Moving Average (EMA) present a strong downward bias across all time frames, signaling further possible depreciation.
Oscillator, MACD, and MOM
The Ultimate Oscillator and Moving Average Convergence Divergence (MACD) echoes this sentiment, each showcasing a bearish trend, indicating a negative price momentum for ONE. In addition, the Momentum Indicator (MOM) supports this view, showing a continuation of the bearish momentum.
Relative Strength Index
Interestingly, the Relative Strength Index (RSI) hints at an oversold condition. While this could imply a potential price reversal, it’s prudent to approach this signal cautiously, considering the overall bearish sentiment surrounding ONE.
Harmony (ONE) — Trade Setup
Unless a significant bullish shift occurs in the overall crypto market, considering a short position might be worthwhile. Traders could aim for targets at $0.0135, $0.0115, and finally $0.010, capitalizing on the expected price decline. It’s essential, however, to have a robust risk management strategy in place, given the volatile nature of the crypto market.
Summary
In summary, Harmony (ONE) seems poised for further potential depreciation in its value, with a bearish outlook prevailing across various technical indicators. As a result, investors and traders should tread carefully, watching the market closely for any bullish reversal signs. However, with a strategic trading setup and a solid risk management plan, there’s a potential to navigate the downturn profitably.