The Present Scenario: HBAR’s Current Status
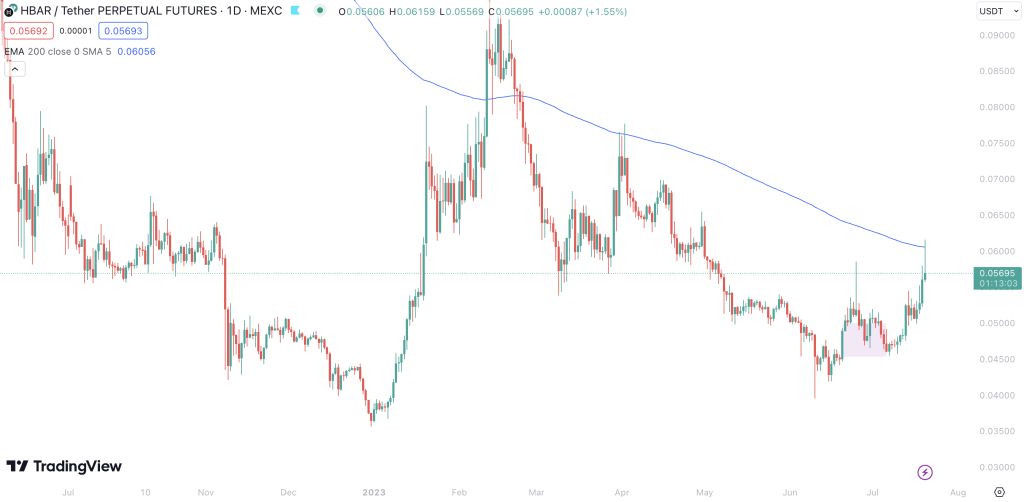
Currently, HBAR, the native token of the Hedera Hashgraph, trades at $0.057, witnessing a 1.59% change in price in the last 24 hours. It’s in an uptrend phase, bouncing off from the 200-day Exponential Moving Average (EMA) line.
While the token has shown resilience in maintaining an uptrend, the real test lies in its ability to breach the 200 EMA line again successfully. This could unlock a profit opportunity of more than 10% if accomplished. This dynamic scenario has all the market elements ready to provide fruitful results for vigilant investors.
Dissecting the Data: Delving into HBAR’s Technical Indicators
- Trends based on Moving Averages: The short and medium-term Simple Moving Averages (SMA) reveal an uptrend for HBAR, indicating positive momentum in these timeframes. Conversely, the long-term SMA shows a downtrend, suggesting that the bullish trend is a more recent phenomenon and has yet to assert dominance over the long-term bearish trend fully.
- Relative Strength Index (RSI): Currently, the RSI is neutral, slightly bordering the overbought territory. This indicates that the token might be gaining more attention from buyers, which could lead to a price increase in the near future.
- Moving Average Convergence Divergence (MACD): The MACD is bullish for HBAR, which is a positive signal. It indicates that the short-term momentum is stronger than the long-term momentum, suggesting upward price movement.
- Oscillator: The oscillator being bullish adds further strength to the overall positive trend. Oscillators help identify periods where the token is overbought or oversold. A bullish oscillator often signifies that the token is due for a price increase.
- Average Directional Index (ADX): The ADX indicates a strong trend. In the current context, given the overall bullish sentiment, this means the uptrend is strong and likely to continue.
Charting the Course: HBAR’s Trade Setup & Outlook
Given the bullish technical indicators and the current price behavior, HBAR is positioned for a potentially profitable short-term play. It is expected to test the 200 EMA line again, with a successful break possibly realizing a profit of more than 10%. However, vigilance is key, as the near-overbought RSI suggests we may witness a cooling-off period before further upward movement. A cautious approach would be to look for confirmation signals of a continued uptrend before committing to the trade.
A Quick Look at HBAR
HBAR is the native cryptocurrency of Hedera Hashgraph, a public network that uses hashgraph consensus, a faster, more secure alternative to blockchain. HBAR serves multiple purposes within the Hedera public network, including network protection from malicious actors, being used to power decentralized applications, and ensuring the smooth functioning of the consensus algorithm.
To Conclude: A Gist of HBAR’s Market Play
In summary, HBAR shows promising signs of a short-term uptrend. Its technical indicators are mostly bullish and look set to test the 200 EMA line. A successful break of this barrier could result in a profit opportunity of over 10%. However, as always in the crypto world, vigilance and careful analysis are paramount for a successful trade.
Remember, this trading opportunity was detected using our comprehensive Crypto Screener. With real-time data analysis and state-of-the-art algorithms, our crypto screener assists traders in making informed decisions in the dynamic crypto market. Stay tuned for more updates and happy trading!