In the dynamic realm of cryptocurrency trading, having precise, actionable insights can distinguish between a profitable trade and a missed opportunity.
Amidst myriad tools available to traders, the Relative Strength Index (RSI) stands out as a reliable compass guiding traders through the uncharted waters of crypto trading. In our latest Substack post, dive into the depths of the RSI, its functionality, and the strategies that can be harnessed to make the most out of its indicators.
What is the RSI?
The Relative Strength Index (RSI) is a momentum oscillator that gauges the magnitude and speed of directional price movements. It ascertains the market’s strength and potential reversal points, assisting traders in making informed decisions.
- Function: The RSI quantifies price momentum by comparing the extent of a crypto asset’s recent gains to its recent losses.
- Scale: It operates on a scale from zero to 100, quantifying momentum and potential reversals.
- Overbought and Oversold Levels: An RSI value of 70 or above indicates that a cryptocurrency is overbought and could be in a bubble, signifying it is a good time to sell. Conversely, an RSI value of 30 or below signals that a cryptocurrency may be oversold, suggesting a potential buying opportunity.
Here’s an example of Bitcoin’s latest RSI chart, highlighting oversold and overbought signals. Take a close look at what happened price-wise.
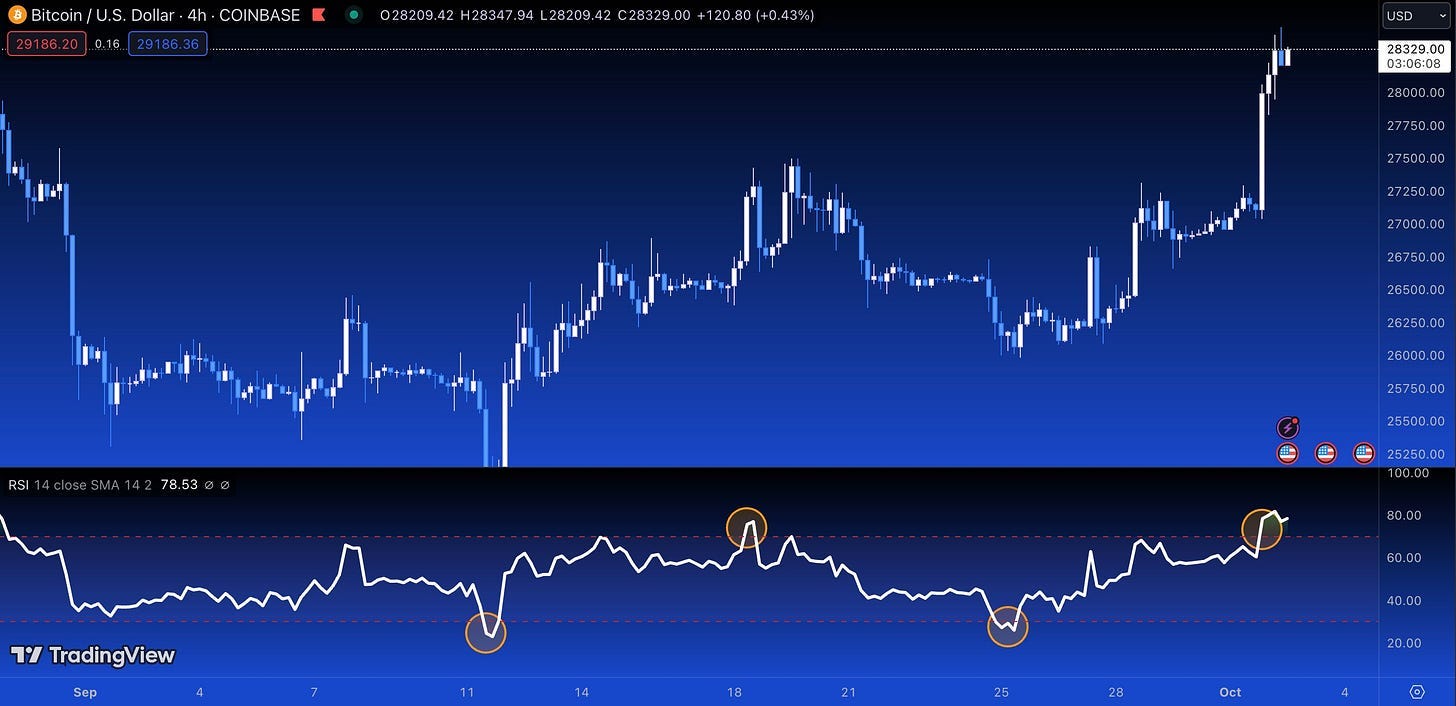
By understanding and monitoring the RSI, traders can better time their entries and exit, potentially leading to more profitable trades and fewer losses. With these insights, the RSI becomes a powerful tool in the trader’s toolkit, helping identify potential opportunities based on market momentum.
RSI Trading Strategies
Understanding and utilizing RSI strategies can significantly impact your trading performance. Here are two main strategies you can employ:
Basic RSI Strategy
The basic RSI strategy involves monitoring the RSI for values below 30 or above 70. These values indicate oversold and overbought conditions respectively, potentially highlighting optimal times to buy or sell.
- Buy Signal: When the RSI is below 30 (considered oversold), it could signify undervaluation, making it a potential buying time.
- Sell Signal: When the RSI is above 70 (considered overbought), it may mean overvaluation, pointing to a possible time to sell.
Advanced RSI Strategy
In this more nuanced strategy, you’re observing the transition of the RSI from extreme values (below 30 or above 70) into a neutral position (around 50). The shift into neutrality can indicate a stabilization in price, presenting another trading opportunity.
- Buy Signal: Consider purchasing when the RSI moves from an oversold status (below 30) to a neutral state (around 50). This change can indicate that the selling pressure is losing momentum, and a price reversal may be on the horizon.
- Sell Signal: Consider selling when the RSI transitions from an overbought condition (above 70) to neutral (around 50), suggesting decreasing buying pressure and a potential downward price movement.
By employing these RSI strategies, you can better predict potential price movements and make more informed trade decisions.
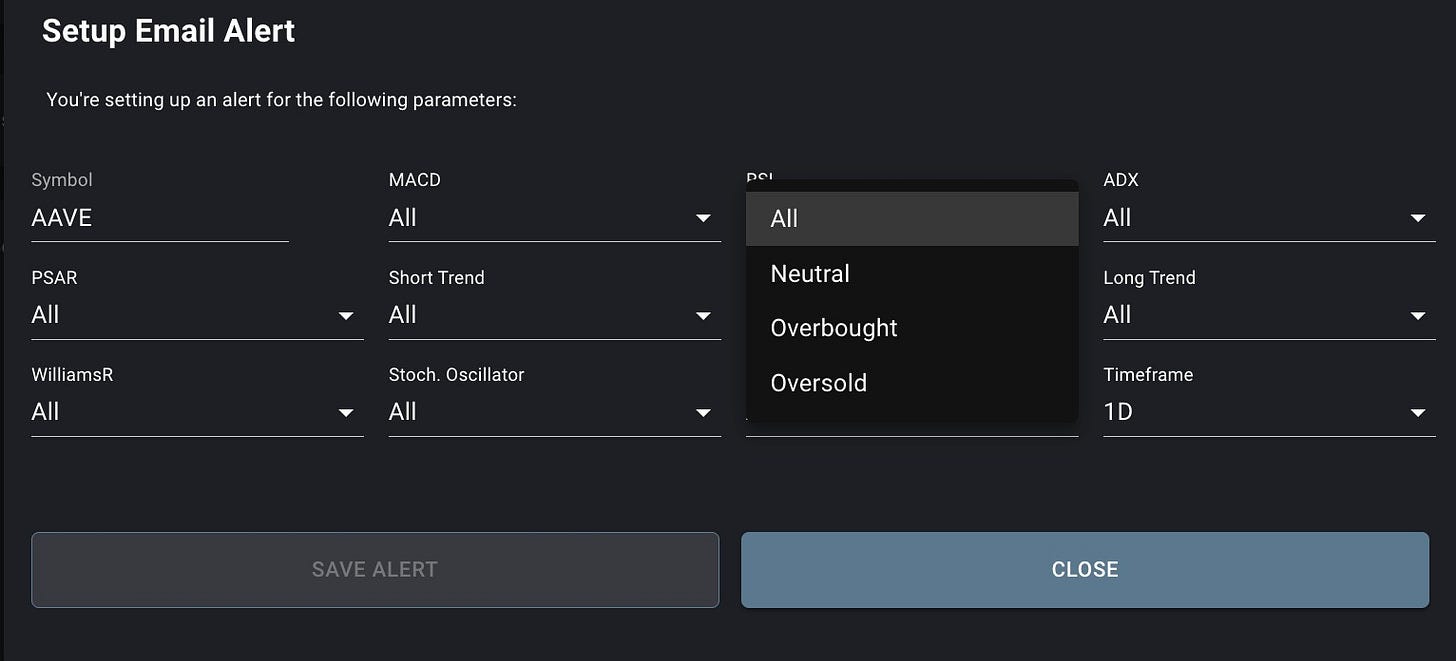
RSI Alerts on CryptoKnowledge
At CryptoKnowledge, we understand the importance of timely entries and exits. Our platform allows you to set up RSI alerts for over 160 cryptocurrencies easily.
Get notified when a token hits overbought or oversold levels or enters a neutral state from these extremes. This feature ensures you never miss an opportunity and make well-informed trading decisions.
Your Next Step(s)
→ Check out the CryptoKnowledge for more details & data
Please note: The information presented in this article is for educational purposes only and does not constitute financial advice. Always do your own research before making any investment decisions.