In the trading world, myriad indicators promise traders the proverbial golden goose. Amidst the crowd, one indicator, in particular, has captured the attention of both newbies and veterans alike – the Stochastic Oscillator.
In this blog post, we’ll dive deep into the intricacies of this widely-used tool and explore its significance in the realm of trading.
Stochastic Oscillator Explained
Before we dive into specific trading strategies, it is essential to understand the Stochastic Oscillator.
The Stochastic Oscillator, often referred to simply as “stochastics,” is a momentum indicator George Lane developed in the late 1950s. The basic idea behind it is that in an uptrending market, prices tend to close near their highs, and during a downtrend, they close near their lows.
Mathematically, the Stochastic Oscillator is represented as:
%K=Current Close−Lowest LowHighest High−Lowest Low×100%K=Highest High−Lowest LowCurrent Close−Lowest Low×100
Where:
- Current Close: Today’s closing price
- Lowest Low: Lowest price for the specified period
- Highest High: Highest price for the specified period
The %D line, which is a moving average of %K, is plotted alongside to produce a signal line.
The values range between 0 and 100 and are typically depicted on a chart with lines drawn at the 20 (oversold) and 80 (overbought) levels. Traders can use these levels to determine overbought and oversold conditions.
Alright, this was some tough theory. So, let’s move on and have a closer look at how to use the Stochastic Oscillator as a trading strategy.
Stochastic Oscillator Trading Strategy
The primary concept behind the stochastic oscillator strategy is straightforward:
Basic Stochastic Oscillator Strategy
The most straightforward but probably also the most effective Stochastic Oscillator strategy incorporates the overbought and oversold levels. In other words, you buy when the oscillator (specifically the %K line) goes below the 20 level (oversold) and then rises back above it. Vice-versa, you sell when it rises above 80 (overbought) and then drops below it. Pretty simple, isn’t it?
Bullish and Bearish Divergences
This Stochastic Oscillator trading strategy is slightly more complex. You find a divergence when the price of an asset and the stochastic oscillator move in opposite directions. A bullish divergence occurs when the price hits a new low, but the oscillator forms a higher low. Conversely, a bearish divergence appears when the price hits a new high while the oscillator forms a lower high.
Crossovers
Another strategy is to watch for crossovers between the %K and %D lines. A buy signal is given when the %K crosses above the %D, and conversely, a sell signal is given when the %K crosses below the %D.
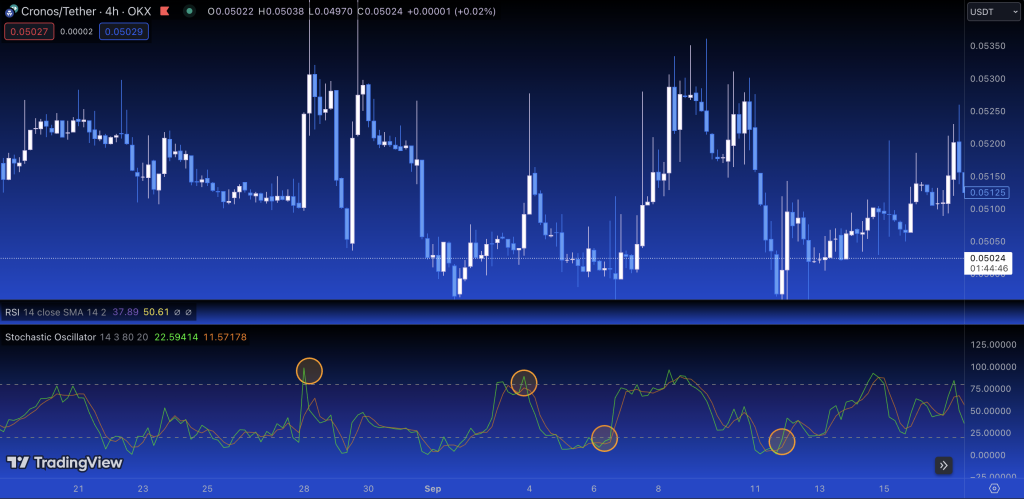
Stochastic Oscillator Example
Below is an example of the Stochastic Oscillator of $CRO. We identified four essential data points corresponding to the Basic Stochastic Oscillator Strategy. Take a close look at the price movement right after.
Stochastic Oscillator Trading Strategies — Success Rates
It’s crucial to mention that, like all technical indicators, the Stochastic Oscillator is not foolproof.
While it can be highly effective in spotting potential reversals, its accuracy is contingent on various factors like market volatility, the chosen time frame, and the overall market conditions.
Based on data analysis, the Stochastic Oscillator provides better results when used on higher timeframes (the daily chart, for example). On top of that, most successful traders will integrate the Stochastic Oscillator with other technical tools or use it in conjunction with fundamental analysis to improve its reliability.
Pros and Cons of the Stochastic Oscillator
Pros:
- Versatility: Works in both trending and range-bound markets.
- Simple Understanding: Overbought and oversold levels are easy to spot.
- Divergence Indicator: Effective in predicting potential trend reversals.
Cons:
- False Signals: Prone to providing false signals, especially in highly volatile markets.
- Not Foolproof: This shouldn’t be used in isolation but rather with other indicators or analysis methods.
How to Spot Stochastic Oscillator Signals
With the rise of digital assets, specifically cryptocurrencies, platforms like CryptoKnowledge have made analyzing over 160 crypto tokens incredibly seamless using the Stochastic Oscillator and other technical indicators.
The platform not only presents data in a user-friendly manner but also lets you set up tailored email alerts. So, rather than constantly monitoring charts, you can receive alerts right in your inbox!
If you’re keen on employing the Stochastic Oscillator in your trading toolkit, I’d highly recommend giving CryptoKnowledge a try. The ease with which you can navigate and interpret data is genuinely game-changing.
The Stochastic Indicator — Wrap-Up
Like many things in life, successful trading is about striking a balance. When used judiciously, the Stochastic Oscillator can be an asset to traders. But always remember the golden rule of trading: never invest what you can’t afford to lose. Happy trading!