Binance Coin (BNB) — Overview
Analyzed Period
Daily Chart
Outlook
Indecisive
Profit Potential
20%
Current Market Status
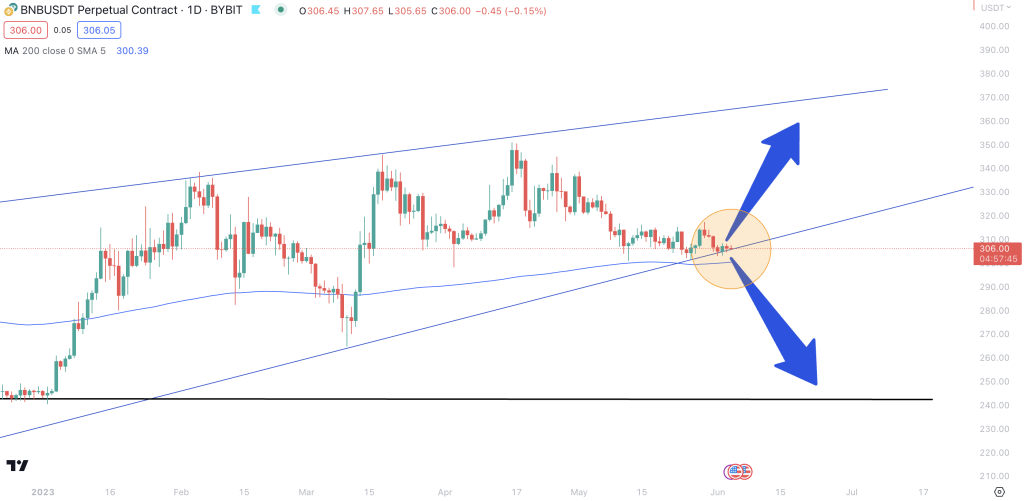
BNB has seen a somewhat tumultuous period, as it trades around the 300-dollar mark, losing approximately 10% since the end of April. However, the silver lining can be found in its trading pattern. BNB is recognized to be trading in a long-term Rising Wedge. This pattern usually forms after an uptrend and suggests a potential bearish reversal in the original uptrend.
While the pattern typically signals a downward trend upon the price, breaking the lower trend line, it also presents opportunities for swing traders. Before a breakout occurs, traders can trade between the convergence lines of the emerging pattern, maintaining vigilance for the completion of the pattern and a breakout.
Key Indicators and Their Signals
The short and medium-term trends for BNB indicate a downturn, while the long-term trend displays an uptrend. Meanwhile, momentum is mixed, with the Moving Average Convergence Divergence (MACD) Line showing a bullish trend as it positions above the MACD Signal Line. However, the Relative Strength Index (RSI) is below 45, indicating bearish conditions. Adding to this complexity, the declining MACD Histogram bars suggest that momentum is weakening.
Regarding support and resistance zones, the nearest support zone for BNB lies at $300, previously a resistance point, with subsequent support at $260. On the other hand, resistance zones are noted at $340 and $400, respectively.
Trade Setup and Outlook
BNB is trading in a Rising Wedge pattern, and the price has retracted to the near $300 support zone. This retracement offers an attractive swing entry opportunity with an upside potential of $340. Following a bullish breakout from a Falling Wedge pattern, BNB reached our target price point of $340 earlier. However, this level has rejected the coin four times to date, reflecting similar rejections observed in August and November of the previous year.
Given this setup, traders are advised to observe if the bottom of the rising wedge holds firm. If it does, this could offer an opportunity to enter for a ride to the top. Alternatively, a short position can be considered upon its break if the bottom fails to hold. Again, patience and attentiveness are key as BNB maneuvers its way through this critical pattern.
About Binance Coin (BNB)
BNB is the native cryptocurrency of the Binance exchange, one of the world’s largest and most popular cryptocurrency exchanges. The Binance Coin offers users of the Binance platform various utilities, including reduced trading fees, participation in token sales, and more.
Furthermore, Binance performs a quarterly BNB burn, contributing to its scarcity and potential for value appreciation over time. As a result, BNB has managed to maintain a prominent position in the market, cementing its status as a leading utility coin.
Summary
Binance Coin (BNB) has recently experienced a slight downturn, losing about 10% of its value since April end, and currently trades around the $300 mark. However, it follows a long-term Rising Wedge pattern which, while often leading to a bearish reversal, can also provide opportunities for astute swing traders. Key market indicators present a mixed picture, with a short and medium-term downtrend and a long-term uptrend.
The momentum also appears divided, with both bullish and bearish signs. BNB finds its nearest support zone at $300, with resistance at $340. As BNB navigates this critical period, traders are encouraged to closely monitor the performance of the bottom of the rising wedge. This would inform whether to enter for a potential rise or take a short position in case of a break.