In the volatile landscape of cryptocurrency, discerning the future price movement of any asset is often akin to reading tea leaves. However, for the Avalanche (AVAX) token, a machine learning algorithm offers a data-driven forecast that may give traders and investors a more tangible footing.
This forecast stands in curious contrast to a wealth of bullish technical indicators, raising important questions for market participants.
→ Discover the CryptoKnowledge iOS app for more details & data
The Machine Learning Forecast
Our machine learning algorithm, after an exhaustive analysis of AVAX’s two-year price history, has found a compelling pattern.
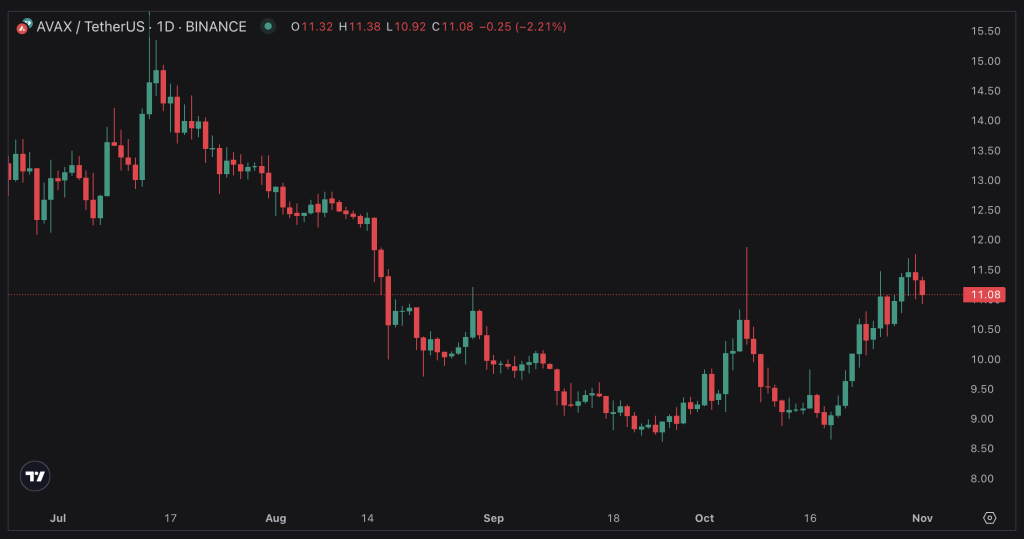
With a high correlation coefficient of 0.97, the algorithm discovered that the current price trajectory of AVAX mirrors three previous patterns. According to this data, there’s an impending drop of approximately 16% over the next seven days, which would plummet the price to around $9.11 (based on AVAX’s price at the time of writing).
Technical Indicators: Confirming or Contradicting?
As intriguing as the algorithm’s forecast is, we must weigh it against the current technical indicators for a more rounded perspective.
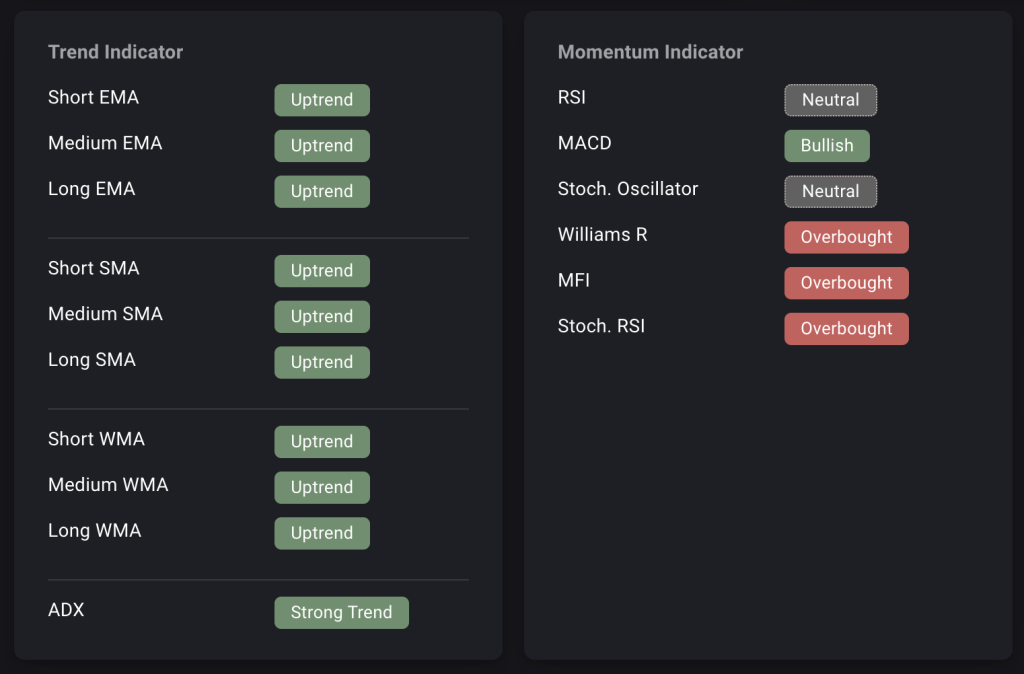
Moving Averages
- Short, Medium, and Long EMA, SMA, WMA: All in an Uptrend
Strength and Momentum Indicators
- ADX: Strong Trend
- Momentum Indicator: Bullish
- RSI: Neutral
- MACD: Bullish
- Stochastic Oscillator: Neutral
Overbought Indicators and Chart Patterns
- Williams R, MFI, Stoch. RSI: Overbought
- Three Black Crows: Bearish
- Wedge: Typically Bullish
- PSAR: Uptrend
At a glance, most of these indicators lean bullish, diverging significantly from the machine learning forecast. However, the ‘Overbought’ conditions and the appearance of ‘Three Black Crows’ could be seen as precursors of the predicted downturn.
Investment Recommendations
Given the contrasting signals from the machine learning forecast and the technical indicators, traders and investors face a complex decision-making landscape. Here are some tailored strategies:
- For Short-term Traders: The bullish technical indicators might seem tempting for quick gains. However, given the algorithm’s bearish forecast and the overbought conditions, employing tight stop-loss orders would be prudent.
- For Long-term Investors: If you’re looking at a longer time horizon, the machine learning forecast suggests a potential “buy-the-dip” opportunity if the price does indeed drop to around $9.1.
Conclusion
The upcoming week for AVAX appears to be a fork in the road, with our machine learning algorithm predicting a downward path, while most current technical indicators suggest otherwise. For traders and long-term investors, this calls for a measured, strategic approach that includes robust risk management.
Whether you lean more on data science or traditional technical analysis, or ideally a blend of both, tread cautiously and invest wisely. The only guarantee in cryptocurrency is its inherent volatility, and AVAX is no exception.
Your Next Step(s)
→ Check out the CryptoKnowledge iOS app for more details & data
→ Start trading AVAX