Today, we focus on Chainlink (LINK), a digital token making waves in the crypto space. With the ongoing volatility in the market, it is essential to analyze LINK’s current status and trade setup. Therefore, you will find a detailed analysis of the current status and a promising trade setup in this article. So, let’s dive into it!
About Chainlink (LINK)
Chainlink is a decentralized oracle network built on Ethereum, designed to connect smart contracts with real-world data, events, and payments. The blockchain cannot access data outside its network, so oracles (a Chainlink network) function as data feeds in smart contracts. The LINK token is used to pay for the data services in the network.
Since its inception, Chainlink has distinguished itself as one of the more promising projects in the blockchain space. Its unique value proposition of bridging the gap between blockchain and the natural world has garnered considerable attention and translated into its market performance.
Chainlink — Current Status and Indicators
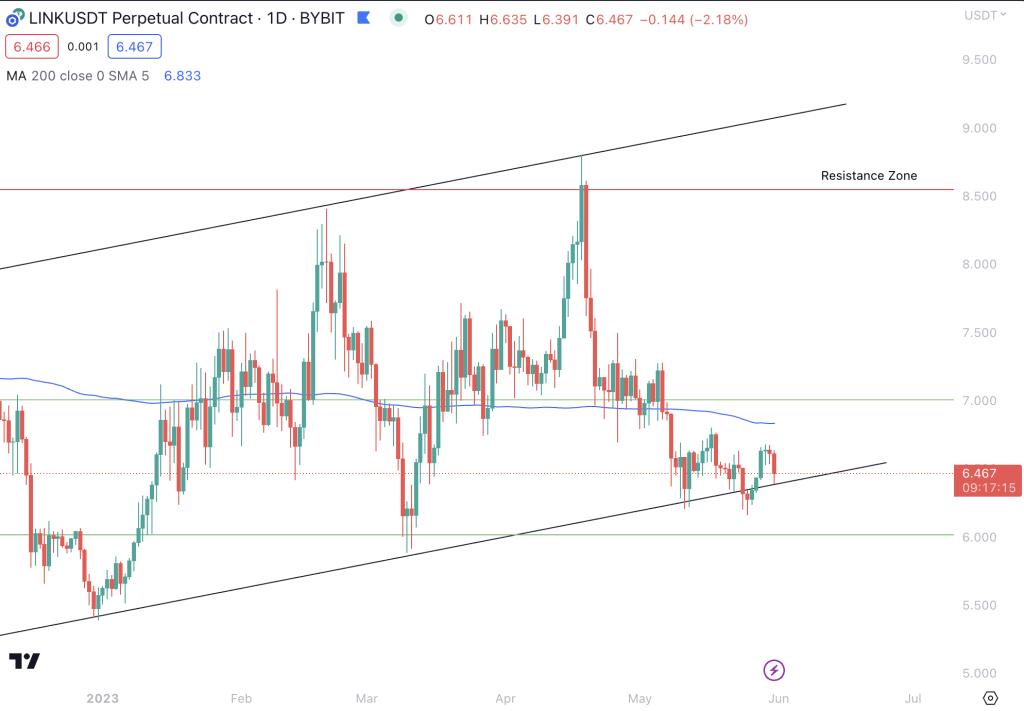
As of writing, LINK is trading at $6.45, experiencing a decline of 25% since the end of April. This downward movement aligns with the overall trend witnessed across all time horizons (Short- Medium- and Long-Term), placing LINK in a broader downtrend.
Diving into the momentum indicators, we observe a mixed signal. The MACD Line is above the MACD Signal Line, hinting at a bullish sentiment. However, the RSI stands at around 50, suggesting a neutral position.
When considering the support and resistance levels, the nearest Support Zone is $6.00, followed closely by $5.50. On the other hand, the nearest Resistance Zone is found at $7.00 (which previously acted as support) and subsequently at $8.50.
Chainlink — Trade Setup
LINK’s current price movement is within a Channel Up pattern, which provides strategic trade setups for savvy swing traders. This pattern allows traders to take positions when the price fluctuates within its channel trendlines, capitalizing on the price’s volatility.
The first trade setup involves entering the channel’s support trendline and exiting near its resistance trendline. The rationale is to ride the price swing within the channel, profiting from the price difference. Setting a price alert at the preferred entry point is advisable to ensure that traders don’t miss out on this opportunity.
However, there’s another setup contingent on the pattern’s completion, i.e., a breakout. Should the price break through the channel’s trendlines, either on the upper or lower side, traders can initiate a trade in the direction of the breakout. Such a scenario could result in the price rushing in that direction, potentially yielding substantial profits.
Summary
LINK’s current market situation offers a compelling case for traders looking to capitalize on the Channel Up pattern. While the short to medium-term trend suggests a downturn, the bullish momentum indicated by the MACD presents an exciting contrast. With the channel’s correct entry and exit strategy, traders could potentially make considerable gains.
Nevertheless, as with all forms of trading, understanding the market and careful planning are crucial. It’s always important to remember that while the technical analysis provides a statistical edge, it doesn’t guarantee success. Always consider multiple factors when making trading decisions and trade responsibly.