XRP Overview
Here’s a comprehensive overview of our XRP analysis based on the chart from 4th June 2023.
Analyzed Period
Daily Chart
Outlook
Bullish
Profit Potential
10% – 30%
XRP — Current Status
Despite the widespread bearish sentiment prevailing in the cryptocurrency market, Ripple’s XRP has emerged as a resilient outlier.
At present, XRP is trading at $0.52, representing a commendable increase of approximately 30% since the beginning of March. Moreover, this sustained upward trend appears to run contrary to the more significant market dynamics, pointing towards the robust demand and strong fundamentals of XRP.
Breakout Patterns on the XRP Chart
From a technical perspective, XRP’s chart patterns provide further insight into its bullish momentum.
At the end of May, XRP broke out from a downward channel on the daily chart, signifying a possible reversal from the previous bearish trend. In addition, it emerged from an inverse head and shoulder pattern, typically a bullish signal in technical analysis, forecasting the potential for further growth.
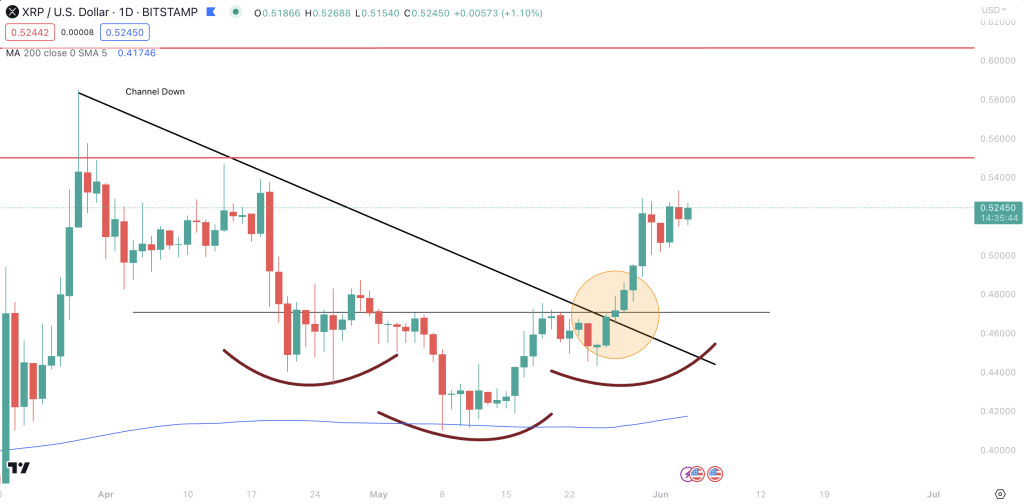
XRP’s Potential for Growth and Resistance Levels
Given the present market dynamics, we believe XRP holds substantial potential for further growth. A significant marker to watch is the resistance at $0.55. Breaking this level could propel XRP toward the $0.60 mark and potentially even $0.70 if the broader market sentiment turns bullish. Consequently, we anticipate a 10-30% profit potential for traders and investors focusing on XRP.
XRP — Indicator Analysis
Digging deeper into XRP’s bullish market indicators, we can better appreciate the robustness of the ongoing uptrend.
SMA & EMA
The Simple Moving Average (SMA) and the Exponential Moving Average (EMA) – two essential tools for traders and investors to identify market trends – strongly indicate an upward trajectory. Moreover, SMA and EMA have marked a consistent climb across different timeframes, underscoring the bullish bias.
Relative Strength Index
Further bolstering this uptrend is the Relative Strength Index (RSI), a tool used to measure the speed and change of price movements. Currently, it’s registering slightly overbought levels. This means there’s been a significant amount of buying interest, usually seen in strong uptrends. However, traders must exercise caution as an overbought RSI can also hint at a potential price correction in the future.
MACD & MOM
A look at the Moving Average Convergence Divergence (MACD), a trend-following momentum indicator, also suggests the bullish momentum is holding. The MACD line has crossed above the signal line, a bullish sign often preceding price increases.
The Momentum (MOM) indicator, a measure that calculates the rate of price change, aligns with this sentiment. It, too, displays bullish momentum, suggesting the positive trend may continue.
Ultimate Oscillator
The Ultimate Oscillator, which combines short, intermediate, and long-term price action into one oscillator, also indicates bullish momentum. This reinforces the broad market sentiment of upward pressure on XRP’s price.
ADX
Despite these positive signs, it’s crucial to note that the Average Directional Index (ADX), an indicator used to quantify the strength of a trend, remains neutral. This suggests that while the direction of the trend is positive, its strength may not be overly powerful. As always in the dynamic crypto markets, continued vigilance and careful monitoring of these indicators are advisable.
Trade Setup and Future Outlook
The current market conditions provide an attractive entry point for XRP.
As noted earlier, traders might consider setting a first target at $0.60 for partial profit-taking. However, based on XRP’s performance thus far in the year, we expect it to challenge this resistance level and even surge to $0.70, provided the broader market supports its momentum.

Summary
Amidst bearish market conditions, XRP stands out with a solid upward trend and potential for significant growth. Chart patterns and indicators highlight bullish sentiments, and the current market conditions suggest an attractive entry point for traders. However, watch for resistance levels and potential profit-taking targets as XRP navigates the volatile cryptocurrency market.
About XRP
XRP is a digital asset and technology that facilitates faster, cost-efficient international transactions. It’s the native cryptocurrency for Ripple, an open-source technology primarily used for transferring digital assets. Ripple was introduced by Ripple Labs Inc., a technology company that develops payment and real-time gross settlement systems.
Ripple’s primary function is to enable seamless transfers between different fiat currencies, with XRP acting as a bridge currency for these transactions. Unlike other cryptocurrencies, XRP’s main utility is to serve institutional use cases, particularly in remittances and cross-border payments.
One of the unique aspects of XRP is its consensus protocol through which transactions are validated, which is significantly different from the proof-of-work system that Bitcoin uses. The Ripple protocol consensus algorithm allows fast, direct money transfers between two parties. XRP transactions are confirmed in around four to five seconds, making it one of the most secured digital assets.
As of my knowledge cut-off in September 2021, XRP consistently ranks among the top cryptocurrencies by market capitalization, highlighting its adoption and continued relevance in digital assets. However, please check the most recent and accurate data, as the crypto market tends to be highly volatile and changes rapidly.