In the diverse world of cryptocurrencies, varied trends and patterns often emerge, offering investors a glimpse into the prospects of tokens. Today, we cast our analytical spotlight on Klaytn (KLAY), a token that is presently drawing attention for its noteworthy trend indicators.
Distinct from other tokens in the market, KLAY is one of the few presenting not a single bullish sign, leaning more towards bearish and neutral indicators. Here, we dissect its performance and trend indicators to offer a comprehensive analysis:
Check out our latest article about Ethereum and Bitcoin
→ Ethereum’s September Analysis: Key Insights and Trade Recommendations
→ Bitcoin Price Update: Your Week-Ahead Outlook Unpacked!
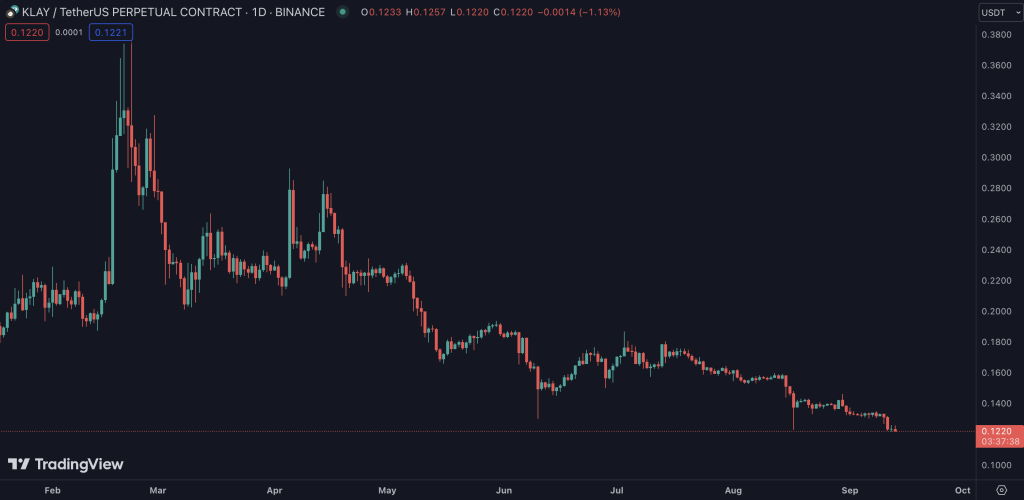
Klaytn (KLAY) Price Analysis — A Year Of Downtrend
Klaytn is one of the altcoins that has been hard by the bear market. However, Klaytn had a good start to the year. The crypto token pumped nicely during the first quarter and outperformed many other altcoins. However, the high rise was followed by an even steeper fall. Moreover, it looks like this fall isn’t over yet.
Let’s take a look at the numbers:
- Currently, Klaytn (KLAY) is trading at a precarious $0.122, marking a 1.60% dip in the last 24 hours.
- When looking at a 7-day range, Klaytn has lost 1.1%
- One the 30-day timeframe, the picture gets darker: -17%
- And during the last year, Klaytn lost almost 43% (worth mentioning that many other altcoins lost even more during that time).
In the long-term scope, the token has seen a significant reduction, hitting a decline rate of 42.54% over the past year. Within this timeframe, it reached a high and low of $0.3302 and $0.1313, respectively.
Klaytn (KLAY) — Technical Indicator Analysis
Trend Indicators
Actually, we only need one word to describe Klaytn’s trend indicators: Downtrend!
Exponential Moving Averages (EMA) and Simple Moving Averages (SMA) on all timeframes (long, medium, and short) point south. On top of that, the ADX, a technical indicator that measures the trend, highlights a strong trend. Finally, the PSAR shows a downtrend too.
Here’s an analysis of the trend indicators:
- Short EMA: Downtrend
- Medium EMA: Downtrend
- Long EMA: Downtrend
- Short SMA: Downtrend
- Medium SMA: Downtrend
- Long SMA: Downtrend
- PSAR: Downtrend
- ADX: Strong Trend
From the Exponential Moving Averages (EMA) and Simple Moving Averages (SMA), it is evident that KLAY is experiencing a sustained downtrend across various timeframes. The PSAR, too, echoes a similar sentiment, reinforcing the bearish narrative. The presence of a strong trend as indicated by the ADX, might suggest that this bearish trend is not a transient phase, but one with a robust momentum.
More posts about KLAYTN (KLAY)
→ ADA, KLAY, XDC — Bullish MACD Crossover — Strong Buy?
Momentum Indicators: A Neutral Stance
Switching our analysis to the momentum indicators, a swath of neutral signals are emerging, potentially indicating a period of market uncertainty for Klaytn:
- RSI: Neutral
- Stochastic Oscillator: Neutral
- Williams %R: Neutral
- Money Flow Index (MFI): Neutral
- Stochastic RSI: Neutral
In stark contrast to the bearish trend indicators, the momentum indicators are largely neutral. From RSI to the Stochastic RSI, the neutral stance hints at a possible period of consolidation or a pause in the market dynamics.

Klaytn (KLAY) – Trade Setup
From day one, we promised our audience to be honest. And the honest answer when asked for a Klaytn trade setup is: Don’t trade it now.
Let’s explain this in detail: From a long-term perspective, it is unclear if the bottom is reached already or if Klaytn is about to decline further. The most likely case is a longer period of sideways movement — and this is something you don’t want to trade. Certainly, long-term holders can DCA at this stage, but even here, we advise to be cautious.
Looking at the short-term potential, the indicators are not giving a precise direction either. Accordingly, we consider the chance of a successful trade as low.
Ultimately, we believe that, based on the technical indicators and our Klaytn analysis, the best trade setup is not to trade Klaytn at this moment.
Conclusion: A Time for Cautious Observation
Investors might be treading on thin ice as KLAY exhibits a landscape devoid of bullish signs. The pronounced bearish tendencies in the trend indicators and a host of neutral signals from the momentum indicators signal a period of caution. Investors and market spectators are advised to keep a vigilant eye on KLAY’s market movements and tread with caution.
In such times, a cautious strategy backed by continuous monitoring and analysis could shield investors from undesirable market fluctuations. As always, investors are encouraged to conduct in-depth research and analysis before making investment decisions in the dynamic crypto market.
Your Next Step(s)
→ Check out the CryptoKnowledge Platform and enhance your trading skills
→ Start trading KLAY