With its intricate charts and patterns, cryptocurrency trading can often feel like deciphering a complex code. Understanding these crypto chart patterns is crucial for traders looking to make informed decisions.
This article will delve into the world of crypto chart patterns, categorizing them into bullish and bearish types. Each pattern will be described with its complexity to spot, probability of occurrence, rarity, and underlying significance.
For more chart patterns, trading signals, and crypto data, download our app in the Appstore or Playstore: Download Now
Bullish Crypto Chart Patterns
Let’s get started with bullish patterns.
Ascending Triangle
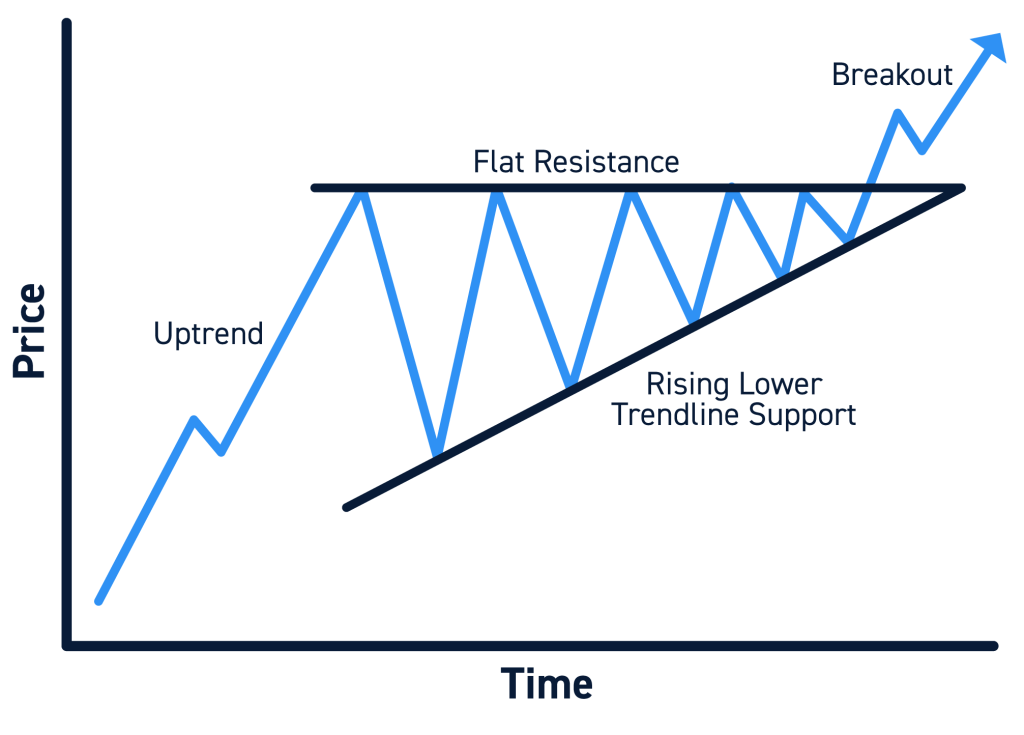
The Ascending Triangle is a highly regarded pattern in the realm of technical analysis, particularly in cryptocurrency trading. Characterized by a flat upper resistance line and a rising lower support line, this pattern suggests a bullish continuation, hinting at a robust upward momentum in the near future. It manifests when the price repeatedly hits a strong resistance level but finds increasing support, creating a series of higher lows that form the ascending lower line. This indicates an accumulation phase, as buyers gradually gain control and are willing to purchase at higher prices, showing a growing bullish sentiment.
Regarding trading, the Ascending Triangle serves as a signal for traders to anticipate a potential breakout. Typically, the likelihood of a breakout increases as the price action gets constricted within this triangle. The point where these two lines converge is often where traders watch for a potential breakout above the resistance line. The key to leveraging this pattern effectively lies in the volume accompanying the breakout – higher trading volume can validate the breakout, increasing the reliability of the pattern.
The Ascending Triangle is not just a signal for an impending price increase; it can also be used to set strategic entry and exit points. Traders often enter a position as the price breaks and close above the resistance line, setting a stop loss below the lower ascending line to minimize potential losses. The target price can be estimated by measuring the height of the back of the triangle and projecting it upwards from the breakout point.
- Complexity to Spot: Moderate
- Probability: High
- Rarity: Common
Bull Flag
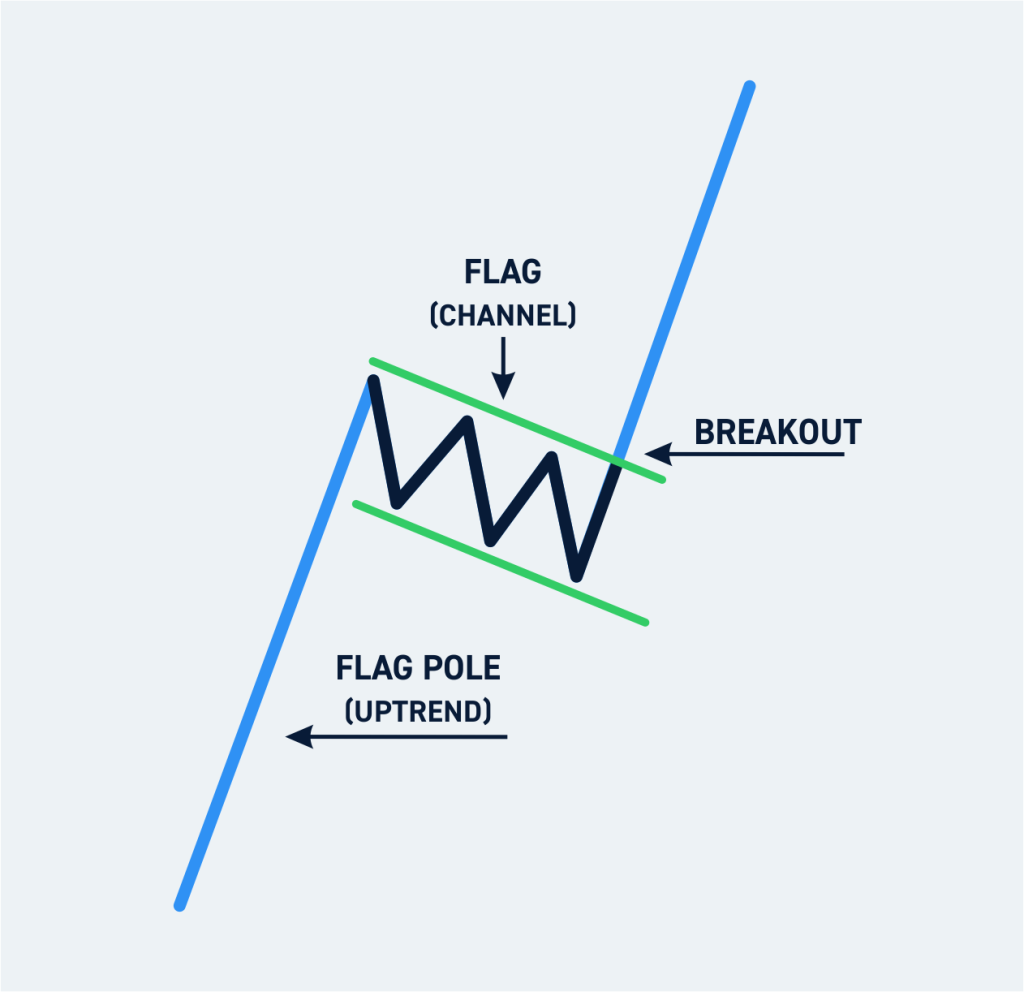
The Bull Flag pattern is a classic continuation pattern observed in cryptocurrency markets, often signaling a pause after a significant upward trend. It resembles a flag on a pole, where the pole is formed by a steep, linear price increase, followed by a rectangular flag pattern representing a period of consolidation with slight downward movement. This pause in upward momentum allows the market to catch its breath before potentially resuming its bullish trend.
The breakout from the upper boundary of the flag often leads to a continuation of the initial upward movement, mirroring the rise that formed the flagpole. Traders typically look for increased volume during the breakout as confirmation.
The Bull Flag is particularly appreciated for its reliability and ease of identification, making it a favorite among both novice and experienced traders.
- Complexity to Spot: Easy
- Probability: Moderate
- Rarity: Common
Cup and Handle
The Cup and Handle is a bullish crypto chart pattern formation that suggests a continuation of an existing trend. It is visually akin to a teacup with a handle, where the cup represents a period of consolidation and stabilization following a substantial upward move. The cup portion is a rounded, “U” shaped recovery from a previous decline, indicating a gradual shift from bearish to bullish sentiment.
The handle, often experiencing a slight downward drift, represents a final consolidation and accumulation phase before a potential breakout. This pattern typically concludes with a decisive breakout from the handle, suggesting a continuation of the prior upward trend. Traders often consider the cup’s depth and the handle formation’s duration in their analysis, looking for a breakout on higher volume to confirm the pattern’s bullish signal.
- Complexity to Spot: High
- Probability: Moderate
- Rarity: Less Common

Hammer
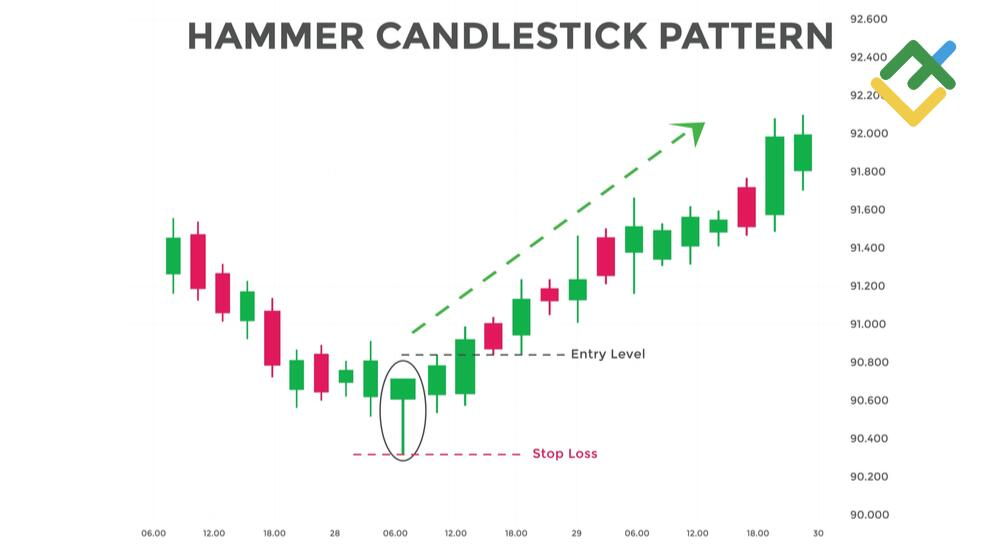
The Hammer candlestick pattern is a potent indicator of potential trend reversal, particularly in downtrending markets. This crypto chart pattern is characterized by its unique shape, the Hammer has a small body at the upper end of the trading range with a long lower wick, which is typically at least twice the size of the body. This formation suggests that during the trading period, sellers pushed prices significantly lower, but ultimately, buyers were able to rally and close the asset near its opening price. This dynamic indicates strong buying pressure and could signal the exhaustion of a bearish trend, hinting at an impending bullish reversal.
Traders often seek confirmation of the Hammer’s bullish signal in subsequent candlesticks; a closing price above the Hammer’s body in the following sessions can reinforce the likelihood of a trend reversal. It’s essential to consider the context in which the Hammer appears – when it occurs after a prolonged downtrend and is accompanied by high trading volumes, its significance as a reversal signal is notably enhanced. However, as with all patterns, reliance on additional indicators and market analysis is crucial for validating the Hammer’s predictive power and integrating it into a comprehensive trading strategy.
- Complexity to Spot: Easy
- Probability: Moderate
- Rarity: Common
Discover our crypto chart pattern blog post!
Crypto Chart Pattern Alerts — 15th December 2023 (including STX, VET, AGIX)
Crypto Chart Pattern Alerts — 14th December 2023 (including CAKE, STEEM, TRX)
Bearish Crypto Chart Patterns
Alright, every medal has two sides. So, let’s continue with bearish patterns.
Descending Triangle
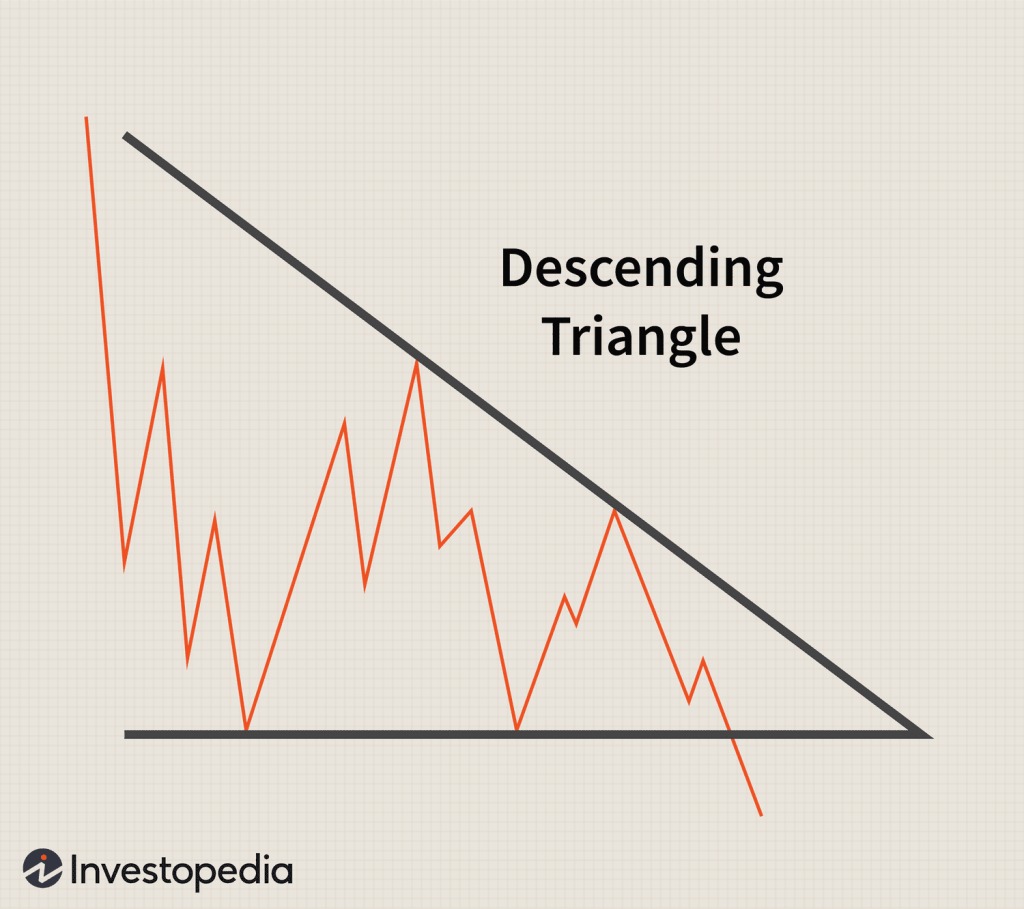
The Descending Triangle is a prominent bearish chart pattern, often signaling a continuation of a downward trend. It is characterized by a flat bottom support line and a descending top resistance line, converging to form a triangle. This crypto chart pattern emerges when sellers are more aggressive than buyers, consistently lowering the resistance level while the support level remains relatively stable.
The repeated testing of the support line with lower highs suggests weakening demand and a potential breakdown below the support line. When this breakdown occurs, it typically leads to a significant price decline, mirroring the height of the triangle. Traders often wait for a confirmed breakout with increased volume for a more reliable signal. The Descending Triangle is particularly valued for its clarity and predictability, making it a staple in bearish market analysis.
- Complexity to Spot: Moderate
- Probability: High
- Rarity: Common
Bear Flag
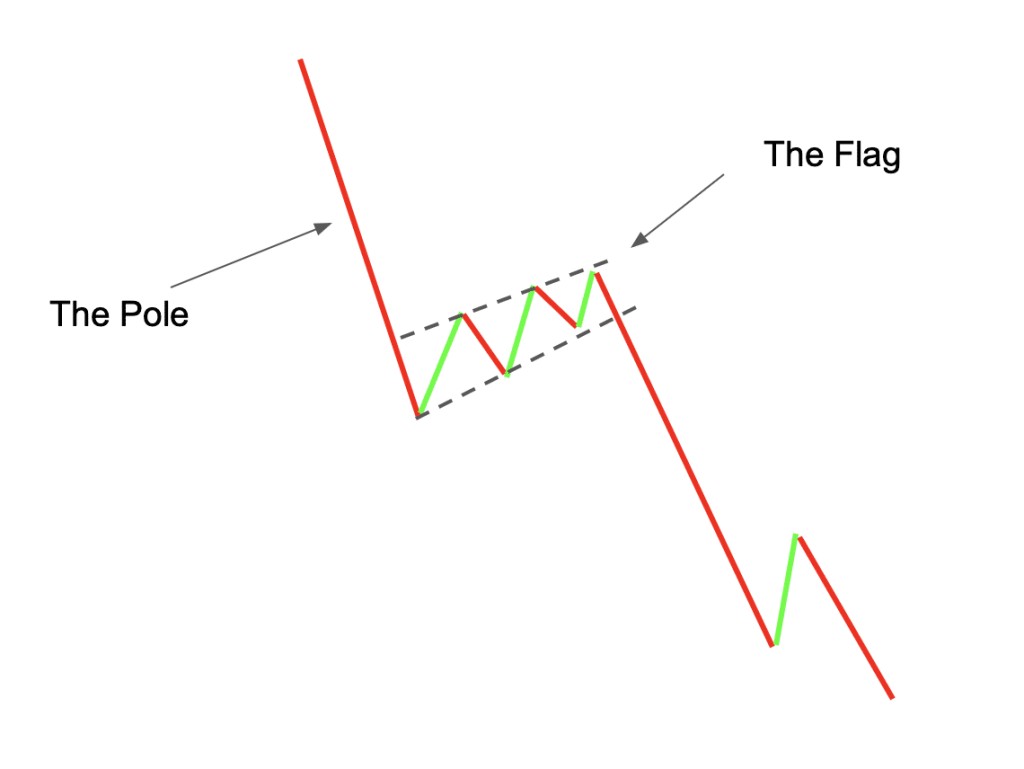
The Bear Flag pattern forms during a predominant downward trend and indicates a brief pause or slight bullish retracement before the market resumes its initial bearish trajectory. This crypto chart pattern resembles a flag at half-mast, where the initial downward price movement forms the flagpole, and the consolidating upward trend forms the flag.
This pattern suggests that the bearish sentiment is still dominant, with the upward flag movement representing a temporary accumulation or profit-taking phase. A breakdown below the lower boundary of the flag, especially on increased trading volume, typically confirms the continuation of the bearish trend.
The Bear Flag is a critical pattern for traders to identify potential entry points for short positions or to manage exits from long positions. Its occurrence during strong downtrends makes it a vital tool for traders looking to capitalize on continued bearish momentum.
- Complexity to Spot: Easy
- Probability: Moderate
- Rarity: Common
Head and Shoulders
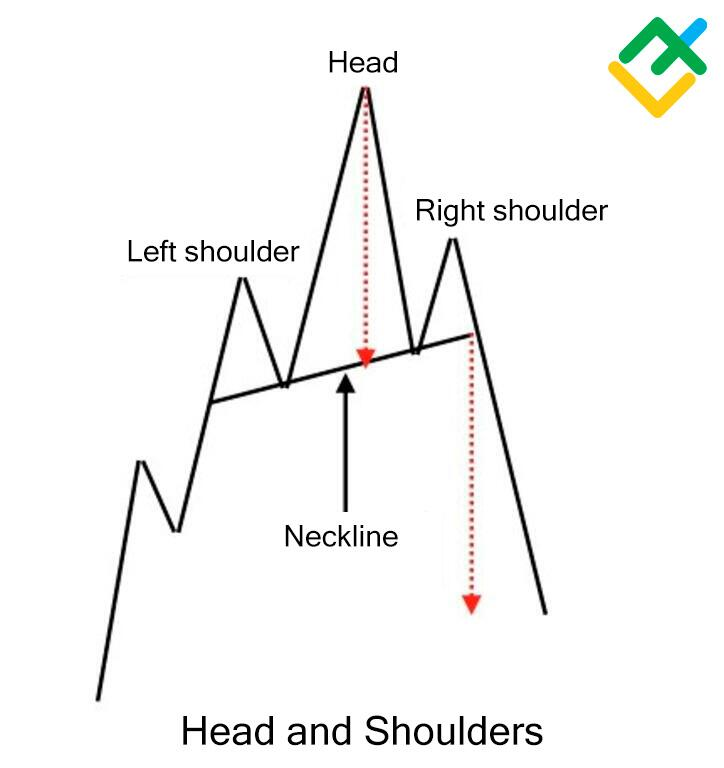
The Head and Shoulders pattern is a highly regarded and widely recognized chart formation that signifies a potential reversal from a bullish to a bearish trend. This crypto chart pattern is characterized by three peaks: the first and third peaks (shoulders) are relatively lower, and the middle peak (head) is the highest. The first shoulder forms during an uptrend, followed by the head as the price reaches a higher peak and then falls back.
The second shoulder forms when prices rise again but fail to hit the height of the head, followed by a decline. The pattern is completed and confirmed when the price falls below the neckline, a support level drawn by connecting the lowest points after the first and second shoulders. The Head and Shoulders pattern is particularly significant as it indicates a major shift in market sentiment. Traders often consider this pattern as a signal to exit long positions or enter short positions, particularly when accompanied by high trading volumes on the breakout from the neckline.
- Complexity to Spot: High
- Probability: Moderate
- Rarity: Less Common
Evening Star
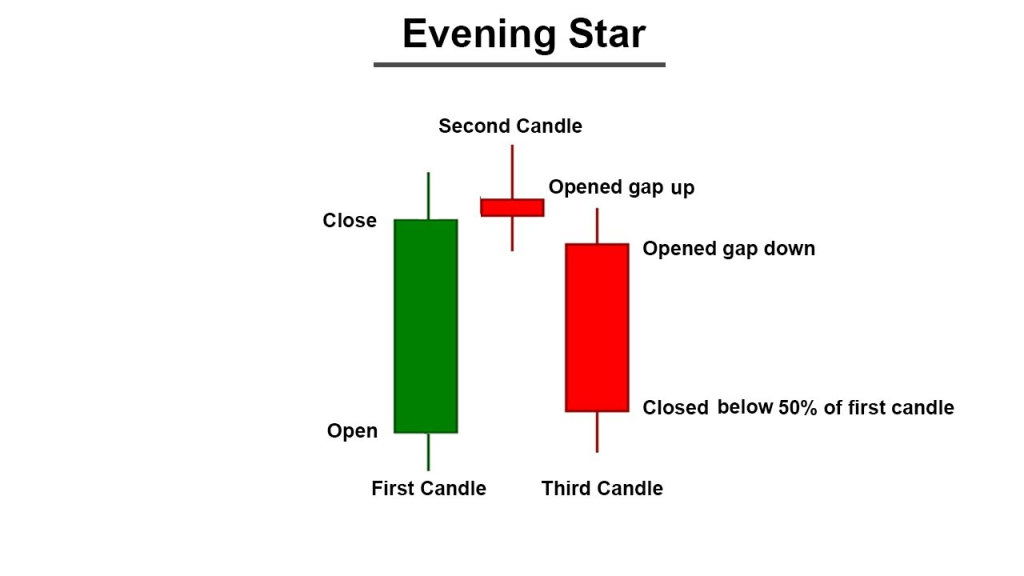
The Evening Star pattern is a potent bearish reversal candlestick formation, typically occurring at the top of an uptrend and signaling a shift in momentum from buyers to sellers. This pattern is a trio of candles: the first is a large bullish candle, followed by a small-bodied star candle that gaps above the first one, and the third is a bearish candle that closes well into the first candle’s body. The star, which can be either bullish or bearish, indicates indecision in the market and a potential change in trend. The third candle’s entry into the first candle’s body confirms the reversal.
This pattern is significant as it captures a moment of market transformation – where bullish confidence wanes, and bearish sentiment starts taking over. Traders often seek additional confirmation through other technical indicators or subsequent candle formations before making significant trading decisions based on the Evening Star. It is a cautionary marker for traders to consider securing profits from existing long positions or preparing for potential short positions.
- Complexity to Spot: Moderate
- Probability: Moderate
- Rarity: Less Common
The Importance of Confirmation When It Comes To Crypto Chart Patterns
While these patterns provide valuable insights, they should not be used in isolation. Traders must seek confirmation from other indicators and market factors to validate these patterns. A successful strategy often involves a combination of chart patterns, technical analysis, and fundamental analysis.
CryptoKnowledge: Your Companion in Crypto Chart Patterns Recognition
At CryptoKnowledge, we understand the intricacies of crypto trading and the pivotal role of chart pattern recognition. We offer free chart pattern recognition tools to support traders in their journey. Our platform simplifies identifying bullish and bearish patterns, enabling traders to make more informed decisions with greater confidence.
Whether you are a beginner or a seasoned trader, CryptoKnowledge is committed to enhancing your trading knowledge and skills. Our tools empower you to navigate the complex world of crypto charts, making your trading journey more efficient and insightful.
Crypto Chart Patterns — Summarized
In conclusion, understanding crypto chart patterns is essential for any trader in the cryptocurrency market. By familiarizing yourself with these patterns and utilizing tools like those offered by CryptoKnowledge, you can gain a deeper insight into market trends and make more informed trading decisions. Remember, in the volatile world of crypto, knowledge is power.
For more chart patterns, trading signals, and crypto data, download our app in the Appstore or Playstore: Download Now