NEO — Current Status: Navigating Through Bearish Currents
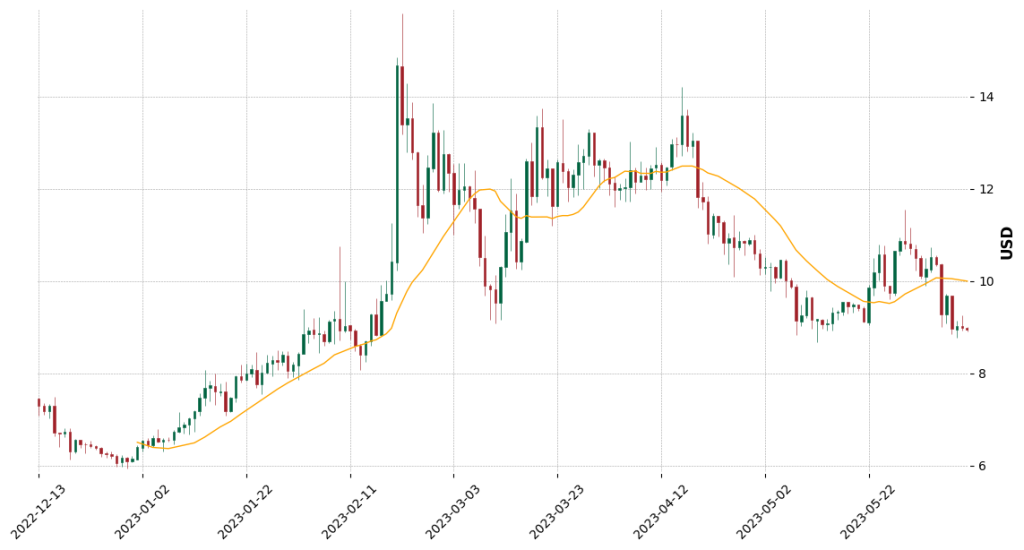
NEO, often called the ‘Chinese Ethereum,’ is currently navigating turbulent market currents. As of recent data, NEO trades at $7.59, a sobering drop of 18.4% in the last 24 hours. The token broke out bearishly from a Descending Triangle pattern and fell below the crucial $9.00 mark, confirming a strong downtrend.
This development has exposed NEO to further downside potential, possibly as low as $6.00. Traders might consider setting price alerts to stay ahead of these rapid changes.
NEO’s price pattern is critical to understanding its current bearish phase. It’s forming a Descending Triangle, a pattern that culminates in a breakout aligning with the prevailing trend. Given the current downtrend, a breakout below the triangle’s lower boundary is plausible, possibly triggering a decline equivalent to the triangle’s widest section.
NEO’s nearest support zones are $7.50 and $6.00, while resistance is $9.00, $12.00, and $15.00.
Analyzed Period
Daily Chart
Forecast Short-Term
Bearish
Forecast Long-Term
Bearish
Technical Indicators – Understanding NEO’s Market Movements
Overview
Moving Average
Strong Down
RSI
Neutral
MACD
Bullish
Details
Based on the moving averages across short, medium, and long-term periods, NEO is firmly in a downtrend. This is signaled by the SMA (Simple Moving Average) in each term length pointing downwards, indicating a prevalent bearish market sentiment.
However, currently neutral, the Relative Strength Index (RSI) suggests a balanced market without overtly bullish or bearish forces. This could indicate a period of consolidation or impending volatility.
Interestingly, the MACD (Moving Average Convergence Divergence) indicator is bullish. Along with the bullish oscillator, these indicators suggest underlying positive momentum that could potentially lead to a price rebound.
On the other hand, the weak ADX (Average Directional Index) implies a lack of a strong trend, adding an extra layer of uncertainty to NEO’s immediate market direction.
Trade Setup & Outlook – “Plotting NEO’s Immediate Course”
Considering the bearish market sentiment, a cautious approach is warranted for NEO in the short term. The prevalent downtrend, confirmed by the SMAs and the Descending Triangle, may further push NEO’s price toward the $6.00 mark.
However, the bullish signals from MACD and oscillator, coupled with a neutral RSI, hint at a possible price recovery. The weak ADX adds uncertainty, suggesting that the market may soon experience a trend change or continue moving sideways.
About NEO
Founded in 2014, NEO, formerly known as Antshares, is often touted as ‘China’s Ethereum’. It’s a blockchain platform and cryptocurrency designed to build a scalable network of decentralized applications. The unique aspect of NEO is its integration of digital assets, digital identities, and smart contracts into its platform, promising a high-performance, self-managed, and legally compliant blockchain ecosystem.
Summary — NEO: Braving the Bearish Storm
In summary, NEO is currently under the grasp of a bearish trend, demonstrated by a significant 18.4% drop and bearish technical indicators. However, hints of bullish sentiment from the MACD and oscillator add a layer of complexity to NEO’s immediate future. While the overall trend leans bearish, traders and investors must closely watch the $6.00 support level and potential bullish reversal signals. As always, in these uncertain times, it pays to be prudent and keep one’s finger on the pulse of the ever-dynamic crypto markets. NEO’s future is unpredictable, but its innovative technology offers a strong foundation for long-term growth and stability.