Delving into the vast world of cryptocurrencies can be as thrilling as complex. Each token presents unique prospects based on its fundamental attributes, technical performance, and broader market conditions.
Among these digital currencies, Quant (QNT) offers a fascinating case for technical analysis. This article will comprehensively explore QNT’s market stance, supported by an analysis of the prevalent trends, momentum indicators, and potential trade setups.
About Quant (QNT)
Quant, with its native token QNT, has been making ripples in the blockchain industry. As the driving force behind the innovative Overledger operating system, Quant’s mission is to bridge the gap between different blockchain ecosystems, fostering interoperability and scalability. This ambitious vision and a solid technological foundation have contributed to QNT’s notable standing in the crypto landscape.
However, it is essential to understand that despite its inherent potential, QNT’s price action, like any other digital asset, is influenced by numerous market factors. These factors contribute to its price trends and volatility, which, when analyzed accurately, can lead to profitable trading opportunities.
Quant — Current Status and Indicators
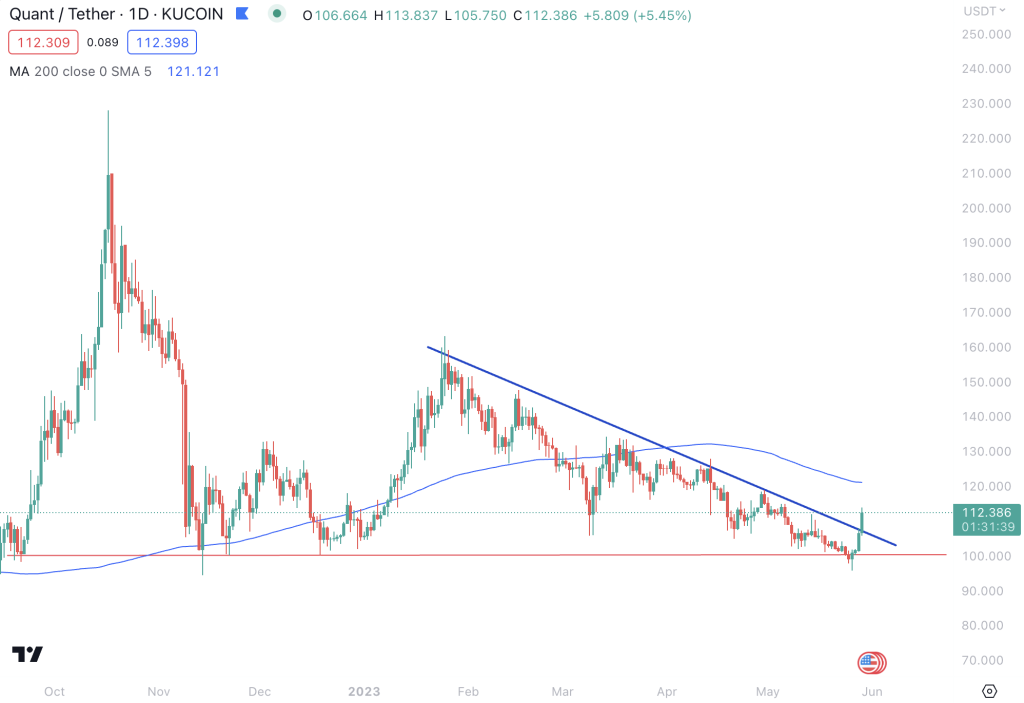
As of this writing, QNT is trading around the $100 mark. However, examining its price action across various time horizons reveals a short, medium, and long downtrend. This means that QNT has been facing considerable selling pressure, pushing its price downward over these periods.
However, while the overall trend might seem bearish, the momentum indicators hint at a potentially different story. For example, the Moving Average Convergence Divergence (MACD), a trend-following momentum indicator, shows the MACD line positioned above the MACD Signal Line. Simultaneously, the Relative Strength Index (RSI), another momentum oscillator, stands above 55. These bullish signals indicate a growing buying momentum, suggesting a possible upward swing in QNT’s price action.
Quant — Trade Setup
Given these indicators, we present a potential trade setup. Currently, QNT shows signs of a bullish breakout from a Descending Triangle pattern. A descending triangle, characterized by a horizontal support line and a downward-sloping resistance line, usually signifies a bearish scenario. However, a bullish breakout from such a pattern can indicate near-term strength and a potential trend reversal.
In QNT’s case, this bullish breakout could lead to an upside potential stretching to the $115-$130 range. Therefore, traders should set a price alert to stay informed about QNT’s price action and seize the opportunity should this scenario unfold.
Support and Resistance
Regarding support and resistance zones, the nearest support for QNT is $100, followed by $87. Conversely, QNT will face resistance at the $130 mark, which previously acted as support. Further resistance levels lie at $150 and $225.
Summary
In conclusion, while QNT has been on a downward slope across all time frames, the bullish momentum indicated by MACD and RSI presents a contrasting picture. With the potential bullish breakout from the descending triangle, QNT might offer an exciting trading opportunity with a significant upside.
However, it’s crucial to approach this with caution, like any investment. Always remember to exercise prudent risk management strategies and conduct thorough research before entering any trade.
Disclaimer: Cryptocurrency trading involves significant risk and may not be suitable for all investors. This analysis does not constitute financial advice, and traders should consider their financial situation, risk tolerance, and investment objectives before making trading decisions.