Understanding the dynamics of individual tokens and coins has become necessary as the digital landscape unfolds with more complex nuances. Decoding technical patterns and analyzing market trends offer a distinct advantage to traders in the volatile cryptocurrency world.
This post will delve into the depths of one digital asset, IOTA (MIOTA), unearthing its technical indicators and potential trading opportunities.
About IOTA
IOTA stands out among the multitudes of cryptocurrencies in the market due to its unique architecture. Departing from traditional blockchain technology, IOTA leverages a Tangle ledger to facilitate secure payments and communications among devices on the Internet of Things (IoT). Offering zero transaction fees and scalable solutions, IOTA has carved a niche for itself in the rapidly expanding IoT sector.
IOTA — Current Status and Indicators
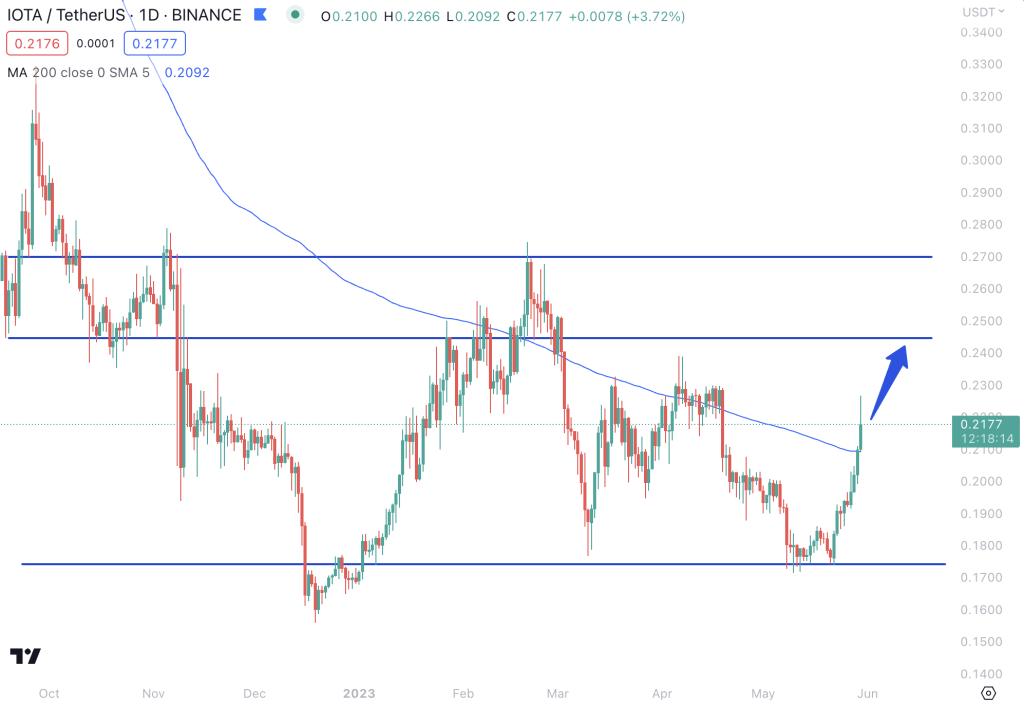
Currently, IOTA is trading around $0.215, edging closer to a significant resistance level at $0.2407. As this pattern continues to evolve, there is a growing potential for a bullish price movement toward this resistance in the coming days.
In the short-term scenario, IOTA reflects a strong uptrend, indicated by its Simple Moving Averages (SMA) and Exponential Moving Averages (EMA). In contrast, the medium to long-term perspectives shows the coin in a downtrend.
The Moving Average Convergence Divergence (MACD) has signaled bullish tendencies since mid-May, indicating an ongoing momentum shift. Adding to this optimistic outlook, the Ultimate Oscillator also shows bullish tendencies, suggesting sustained buying pressure.
However, traders must observe caution as the Relative Strength Index (RSI), a critical tool to measure the speed and change of price movements, currently leans towards the overbought-neutral zone. This suggests a possible slowdown in buying pressure, necessitating careful monitoring.
IOTA — Trade Setup
Considering the current trading scenario, two potential trade setups present themselves. The first involves capitalizing on the likely bullish momentum towards the $0.2407 resistance level. This consists of riding the wave until this resistance, using the short-term uptrend.
A second trade setup comes into play in the event of a breakthrough past this resistance. This situation opens the door for a potential upside to the next resistance level, approximately around $0.27.
While these trade setups offer promising opportunities, traders must approach cautiously due to the overbought-neutral RSI and the medium to long-term downtrend. A prudent approach involves setting a stop loss to mitigate potential risks and constantly monitoring market trends to adapt to sudden price movements.
Summary
In conclusion, IOTA is a digital asset shrouded with intricate complexities. While the short-term indicators point towards potential growth, the medium to long-term perspectives warrants caution. The crux of trading in the current scenario lies in closely observing the market and exploiting potential opportunities. It’s also vital to ensure careful risk management and set price alerts to keep up with the dynamic world of cryptocurrencies.
We hope this analysis will assist you in making informed trading decisions, and we will keep providing updates and more insights into the exciting realm of cryptocurrencies.