The Relative Strength Index (RSI) is a widely recognized tool among traders to gauge the speed and magnitude of price movements. By understanding it, traders can make more informed decisions about when to buy or sell. Let’s do that – RSI for beginner!
What is the RSI?
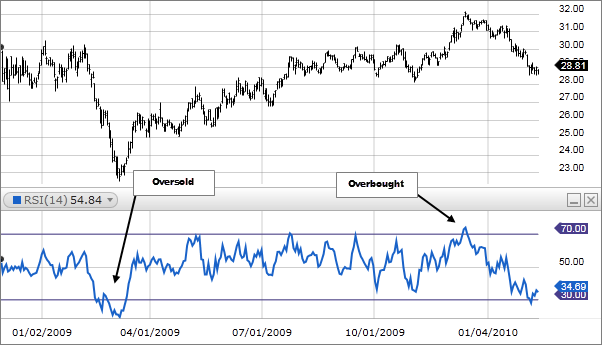
The Relative Strength Index is a momentum oscillator that evaluates the extent and speed of price changes, helping traders discern overvalued or undervalued conditions of a security. Developed by J. Welles Wilder Jr., the indicator oscillates between zero to 100. Typically, an RSI reading above 70 suggests an overbought condition, while a reading below 30 indicates an oversold state.
How Does It Work?
It assesses the strength of a security on days when prices rise against its strength on days when prices fall. This comparison helps traders gain insights into how a security might perform. An RSI can be plotted beneath an asset’s price graph, rising with increasing up days and falling with more down days.
Calculating the RSI
The calculation involves two steps:
- The initial calculation, which considers the average percentage gain or loss over a specified look-back period, typically 14 days.
- A subsequent smoothing process, which ensures the indicator approaches the extremes of 100 or zero only in a notably trending market.
Why Is RSI Important?
- Validates trends and reversals.
- Identifies overbought and oversold states.
- Provides traders with entry and exit signals.
- Enhances trading strategies when used with other indicators.
Utilizing it in Different Market Scenarios
- Adapting with Trends:
- Recognizing Market Direction: Understanding the primary trend of a security can significantly refine the interpretation of RSI readings. For instance, during a bullish trend, a reading above 70 might not necessarily mean an immediate sell, as the asset could remain overbought for extended periods.
- Insights into Trend Shifts: It has the adaptability to respond to market trend shifts. A declining RSI in an uptrend or a rising RSI in a downtrend can offer insights into potential trend reversals or continuations.
- Overbought and Oversold Indications:
- Bullish Signals: An RSI reading crossing above 30 after being in the oversold territory can be an indication of a potential upward movement or a reversal from a bearish trend.
- Bearish Signals: Conversely, when the indicator drops below 70 after being in the overbought zone, it may suggest a potential downward movement or a reversal from a bullish trend.
- Deciphering RSI Divergences:
- Bullish Divergence: Occurs when the price makes a new low, but the RSI makes a higher low. This divergence can be an early indication of a positive momentum shift.
- Bearish Divergence: Conversely, when the price sets a new high, but the RSI fails to achieve a new high, it might indicate a potential momentum decrease.
- Contrasting RSI with MACD:
- RSI’s Core Function: The RSI primarily gauges the momentum of recent price changes based on highs and lows, offering a bounded reading between 0 and 100 to indicate overbought or oversold conditions.
- MACD’s Mechanism: The MACD, on the other hand, showcases the relationship between two moving averages of a security’s price, providing insights about potential crossovers as bullish or bearish signals.
Conclusion
The indicator is an integral component of a trader’s toolkit. It provides invaluable insights into market conditions, helping traders anticipate potential price movements.
As with any tool, the RSI is most effective when used in tandem with other indicators and a well-thought-out trading strategy. Understanding it and its nuances can offer traders an edge, guiding them toward more informed and confident trading decisions.
Trade Confidently with CryptoKnowledge
Armed with the insights into the RSI, you’re better equipped to interpret its readings on our CryptoKnowledge platform. Our mission is to offer traders the knowledge and tools required to navigate the intricate landscape of cryptocurrency trading. We trust this article has fortified your trading acumen. Best wishes for successful trading with CryptoKnowledge!