SOL at Present – Delving into the Current Market State
Trading at $18.93 currently, SOL’s price has observed a slight increase of 1.53% over the last 24 hours. However, the overall status of the token depicts a bearish atmosphere, hinting at the potential continuation of a downward trajectory.
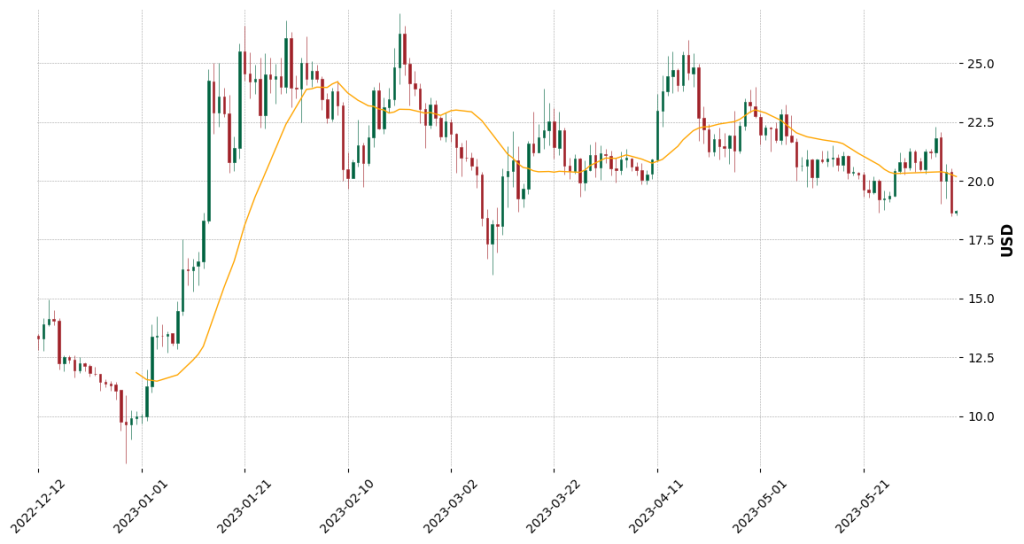
Key chart aspects reveal that the price broke the $20 support and slid below the 200-day moving average. These developments could indicate a possible resumption of the downtrend, exposing the token to the downside risk of reaching $15.
Support Zones for SOL are charted at $20, which has been recently breached, and then at $15. Conversely, Resistance Zones lie ahead at $25 – $30 and subsequently at $40, posing hurdles for any uptrend aspirations.
SOL — Technical Indicators
Technical indicators are valuable tools for gauging market trends. Let’s evaluate SOL’s key indicators:
Trends based on Moving Average: The Simple Moving Average (SMA) across the short, medium, and long terms suggests a prevailing downtrend for SOL. This consistency underlines a sustained bearish sentiment.
Relative Strength Index (RSI): The RSI for SOL is in the neutral zone, indicating a balanced market without overwhelming selling or buying pressure.
Moving Average Convergence Divergence (MACD): The MACD for SOL is bearish, further endorsing the dominant bearish trend. This might imply a continuation of the downward momentum in the near term.
Oscillator: Presenting a contradictory view, the Oscillator for SOL is bullish, hinting at potential price recovery.
Average Directional Index (ADX): The ADX reflects a weak trend strength, suggesting that the ongoing bearish trend might lack intensity and be prone to potential reversals.
SOL — Short-Term Price Development Outlook
Given the bearish undercurrent, the immediate outlook for SOL could pose particular challenges. The moving averages and the bearish MACD point towards further potential dips. Nevertheless, the bullish Oscillator and weak ADX imply a scope for price recuperation or trend reversals.
A significant upward trend reversal would require SOL to break the resistance at $25 – $30 decisively. Yet, considering the prevailing market conditions and technical indicators, SOL might be geared towards testing the $15 support level in the short term.
About Solana
SOL is the native cryptocurrency of the Solana blockchain. Solana aims to provide fast, secure, scalable decentralized apps and crypto services. It leverages a unique consensus architecture known as Proof of History (PoH), in combination with the Proof of Stake (PoS) mechanism, to achieve high transaction speeds without sacrificing security.
Wrapping Up SOL – Key Takeaways from the Analysis
In a nutshell, SOL is grappling with a bearish market trend, reflected by vital technical indicators and recent price movements. The downward break below critical support and moving averages signals potential further drops. However, the bullish Oscillator and weak ADX suggest possibilities of trend reversals.
Despite the immediate bearish outlook, the long-term potential of Solana, backed by its high-performance technology, is considerable. Observing how SOL navigates the current market turbulence and shapes its future trajectory will be interesting. Stay informed and trade with caution.