Current Status — BNB’s Turbulent Ride
As of the latest update, Binance Coin (BNB) currently trades at $245.88, reflecting a modest 1.66% increase within the last 24 hours. While these fluctuations may appear minimal on the surface, the unfolding market dynamics suggest a complex picture.
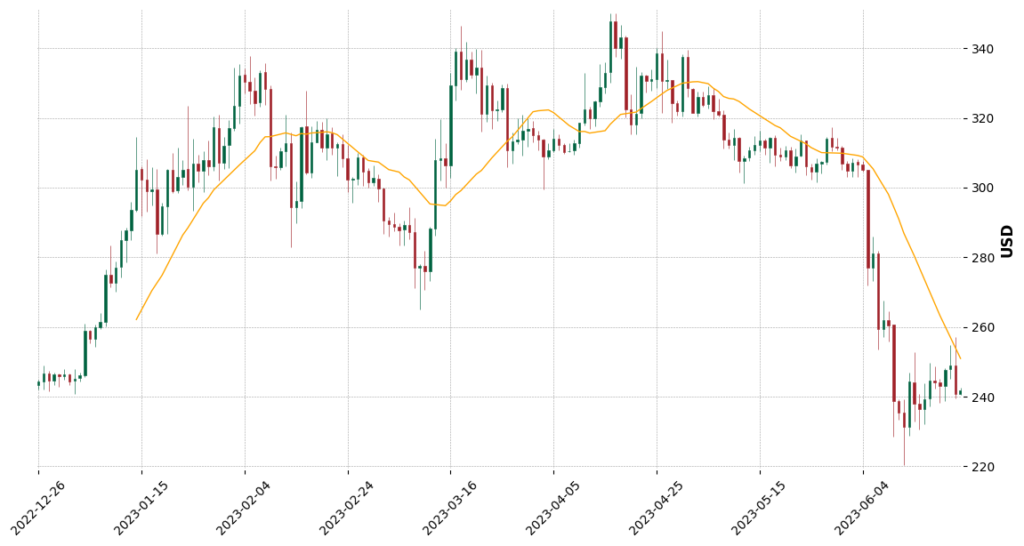
Following a bearish breakout from the rising wedge pattern, BNB saw a downtrend reversal, slipping below its 200-day moving average (~$300). This downward shift translated into an oversold status, with the Relative Strength Index (RSI) dropping below 20 near the $225 support level. However, the coin managed to bounce back up to the $260 resistance, only to get rejected thus far.
With the price projected to dip back to around the $225 support for another swing trade, traders should be cautious. This setup involves a higher level of risk as the overall trend is downward.
Technical Indicators — Unraveling BNB’s Market Signals
Let’s delve deeper into BNB’s technical indicators to understand the coin’s trajectory better.
Starting with trends based on the moving average, BNB exhibits a downtrend across the short, medium, and long term, as depicted by the Simple Moving Averages (SMAs). This downward trend corresponds to decreased BNB’s price over various periods.
In contrast, the RSI stands neutral. This indicates a balance between the selling and buying pressures in the BNB market, which could result in a sideways movement.
The Moving Average Convergence Divergence (MACD), a popular momentum indicator, gives a bullish signal. This suggests that the short-term momentum in BNB’s price may exceed its long-term momentum, hinting at potential upward price movements.
However, the Ultimate Oscillator, another momentum indicator, signals bearish conditions. This discrepancy with the MACD could indicate volatility and an upcoming trend reversal.
The Average Directional Index (ADX) is strong. The ADX measures the strength of a trend, and a strong ADX implies a strong downtrend in BNB’s case.
Lastly, the nearest support zone is $220, while the nearest resistance zones are $260 (previous support) and then $300.

Trade Setup & Outlook — Forecasting BNB’s Short-Term Trends
Given the technical indicators and the current status of BNB, the short-term outlook suggests potential volatility. The overall trend is down, confirmed by the moving averages and the strong ADX. However, the bullish MACD suggests a potential price reversal soon.
For traders looking to engage in higher-risk swing trade, the price dipping back toward the $225 support could provide an opportune entry point. This would be followed by a potential exit at the $260 resistance level. However, the overall bearish trend and the bearish oscillator signal the need for caution and vigilant monitoring of the market dynamics.
Summary — Deciphering BNB’s Market Prospects
In summary, BNB’s market position presents an intricate picture. While the coin is currently navigating a downward trend, some technical indicators suggest potential reversals. Traders should closely monitor these mixed signals, making informed decisions based on continual market changes.
While the short-term future of BNB contains uncertainties, the token’s integral role in the expansive Binance ecosystem bodes well for its long-term potential. Whether you’re a seasoned trader or a crypto enthusiast, the unfolding BNB story promises to be a captivating journey.
About BNB — The Journey of Binance Coin
Binance Coin (BNB) is the native cryptocurrency of the Binance exchange, one of the largest and most popular crypto exchanges worldwide. Initially launched on the Ethereum blockchain, BNB migrated to Binance’s own blockchain, Binance Chain, in 2019. BNB plays an essential role within the Binance ecosystem, providing utility for transaction fees, participation in token sales, and much more.
Binance Coin (BNB) Live Chart
[stockdio-historical-chart symbol=”BNB” stockExchange=”Crypto” width=”880″ height=”580″ motif=”financial” palette=”financial-light”]