ADA — Current Status
Analyzed Period
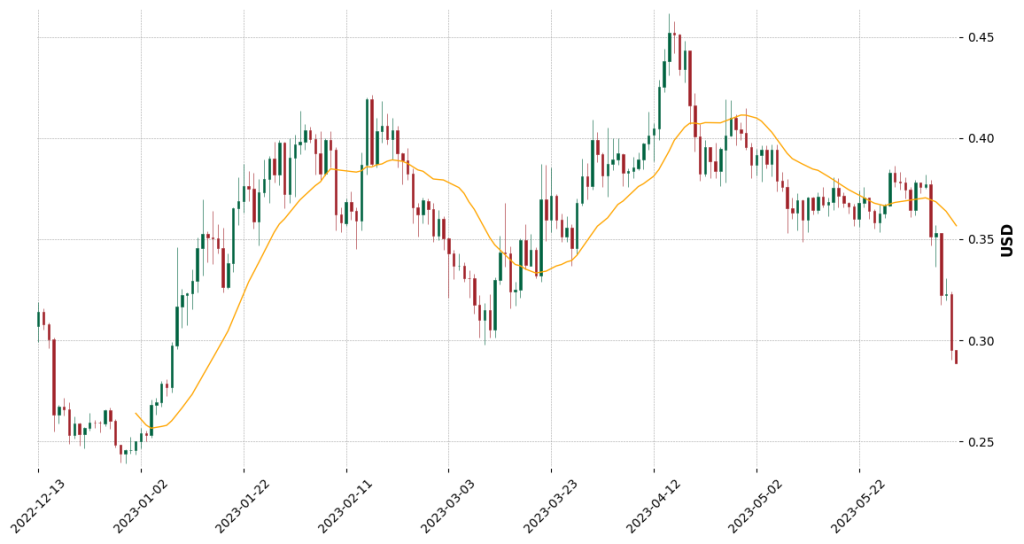
Daily Chart
Forecast Short-Term
Bearish
Forecast Long-Term
Bearish
The cryptocurrency world is no stranger to volatility, and Cardano’s native token, ADA, bears no exception. Currently trading at $0.262, it’s taken a substantial 12.79% plunge within 24 hours. In the rollercoaster-like landscape of crypto, ADA has recently experienced a bearish breakout from its ‘Channel Up’ pattern, falling below the significant 200-day moving average at $0.35. This confirms a downtrend.
Notably, ADA now hovers near the $0.25 support. This proximity raises the possibility of a short-term bounce back. Yet, this brings higher risk due to the overarching downward trend. The nearest support and resistance zones rest at $0.30 (already broken), $0.25, and $0.40, $0.50, respectively. ADA’s price alert could be a wise consideration in light of ADA’s volatility.
ADA — Technical Indicators
Overview
Moving Average
Strong Down
RSI
Neutral
MACD
Bearish
As indicated by the moving averages— short, medium, and long-term—the journey of ADA all point towards a persistent downtrend. These Simple Moving Averages (SMAs) hint towards an extended bearish scenario, potentially leading to further price depreciation.
The Relative Strength Index (RSI) remains neutral despite the downward trajectory. This signals a balance between buying and selling pressure and might suggest stability amidst the bearish climate. However, the Moving Average Convergence Divergence (MACD), another critical tool, shows a bearish signal, indicating that sellers are currently dominating the market.
Interestingly, the oscillator, employed for momentum measurement, signals bullish. This counteracting signal suggests an imminent potential for price bounce-back, adding a layer of uncertainty to ADA’s price evolution. Finally, the Average Directional Index (ADX) demonstrates weakness, reflecting a lack of a potent trend. This could imply a consolidation phase or trendless state for ADA immediately.
ADA — Outlook & Trade Setup
ADA’s short-term outlook appears bearish, given the current technical indicators and market conditions. ADA’sominant downtrend suggested by the moving averages and the bearish MACD largely steers towards potential further declines.
Nevertheless, the bullish oscillator and the neutral RSI inject a degree of hope for a near-term price reversal. With the weak ADX, these indicators hint at a potential phase of price volatility or consolidation in the short term.
Thus, while the bearish currents may continue in the immediate future, the possibility of turbulence is tangible. Keeping a watchful eye on market movements and adapting strategies based on price breakouts from current levels will be vital to navigating ADA’s waters.
About ADA
ADA, the digital token of the Cardano blockchain, stands out with its ambition to create a balanced and sustainable cryptocurrency ecosystem. ADA ensures rigorous security and flexibility for future enhancements with its research-first-driven approach and layered blockchain architecture.
Wrap-Up
In the current status, ADA has taken a substantial dip while moving within the volatile cryptocurrency market. Vital technical indicators present a mix of signals, with moving averages and MACD implying a bearish trend, but the bullish oscillator and neutral RSI suggest potential future bounce-back. As a result, the immediate future of ADA might still hold a bearish bias, but the possibility of short-term price reversal remains. Despite these challenges, ADA, the beating heart of the Cardano blockchain, continues its mission to revolutionize the crypto space with its innovative, research-first approach.