The Present State: QNT’s Journey to a Bullish Breakout
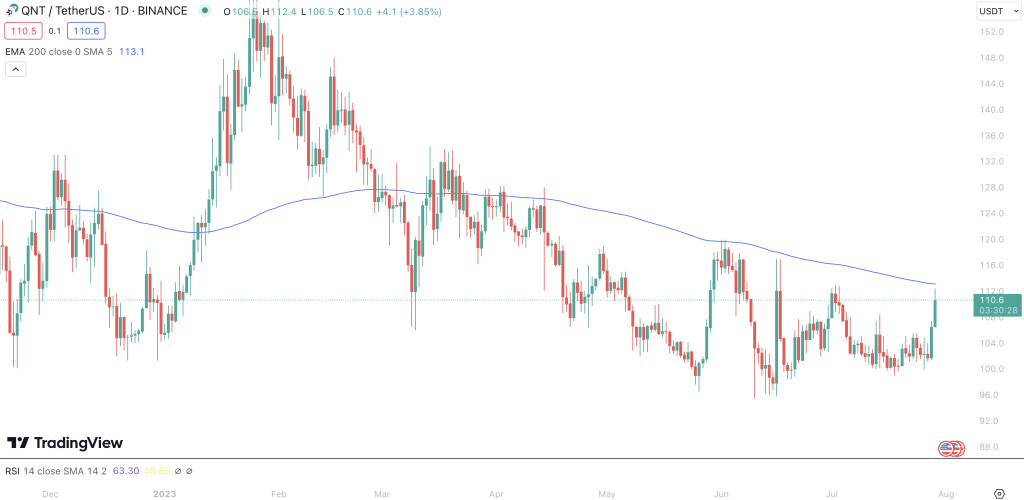
Currently, Quant (QNT) trades at an impressive $110, marking a +3.8% change in the last 24 hours. The currency broke out from a Descending Triangle pattern, a classic reversal formation, indicating a potential shift from a bearish to a bullish trend. We’re seeing this momentum reflected in the price movement.
If it sustains this direction, QNT could likely revisit its 200-day Moving Average at around $118, which presently serves as a minor resistance level.
Quant — Reading the Technical Indicators
Looking at the trends based on the moving averages, we notice the Short Term and Medium Term Simple Moving Averages (SMA) are in an uptrend while the Long Term SMA is in a downtrend.
RSI (Relative Strength Index) is neutral, indicating that the token is currently neither overbought nor oversold.
The Moving Average Convergence Divergence (MACD), a trend-following momentum indicator, shows a bullish divergence. This could be a positive sign for QNT’s price in the future.
The Oscillator, another key indicator, also suggests a bullish sentiment. This typically suggests higher price volatility and potential trading opportunities.
Finally, the Average Directional Index (ADX) is strong, indicating robust trend strength. In this context, the strong trend could imply the continuation of the bullish breakout.

QNT’s Trade Setup & Outlook: Potential Uptrend?
Given the technical indicators and recent price movement, we could see a trend reversal for QNT. The Bullish breakout from the Descending Triangle and a positive MACD divergence suggest upside potential for QNT. If QNT breaks above its 200-day MA (around $118), that could confirm a trend reversal, potentially propelling the price up to $130.
Delving into Quant (QNT)
Quant (QNT) is a unique blockchain project that enables the interconnection of multiple blockchains operating at a global scale. It does this through Overledger, the first Blockchain Operating System, making it possible to develop multi-chain applications (MApps). By connecting these diverse systems, QNT aims to solve current blockchain projects’ major limitations, such as system interoperability.
In Summary: QNT’s Prospective Bullish Trend
In conclusion, QNT’s bullish breakout from a Descending Triangle, backed by the positive MACD divergence and a bullish Oscillator, hints towards a potential uptrend. The short-term price development could see QNT revisiting and potentially crossing the $118 mark, leading to a possible rise up to $130.
However, as with any market, this analysis should not replace personal due diligence and risk management strategies.