Welcome to this comprehensive trading alert, where we dive into the cryptocurrency market, spotlighting four tokens that are currently flashing a bullish crossover. As savvy traders know, understanding the nuances of market indicators like the Moving Average Convergence Divergence (MACD) and the Relative Strength Index (RSI) can be crucial in making informed decisions.
In the following sections, we will analyze four specific tokens in-depth – SHIB, BNB, HBAR, and ZEC. Each section will outline the current stock price, resistance level, support level, 24-hour percentage change, and the current RSI of these tokens. More importantly, we’ll dissect how these indicators work together to illustrate potential upside and the overall market sentiment surrounding each token.
Whether you’re a seasoned trader or just getting started, this post aims to equip you with valuable insights, enhancing your market understanding and investment strategy. Let’s get started!
Decoding the Indicators: MACD and RSI
The Moving Average Convergence Divergence (MACD) and the Relative Strength Index (RSI) are key indicators in the volatile cryptocurrency market. The MACD, a trend-following momentum indicator, identifies potential buying opportunities when it crosses above the signal line, indicating a bullish trend. The RSI, on the other hand, helps identify potential overbought or oversold conditions, adding depth to our analysis.
SHIB: Potential for a 16.3% Upsurge
Despite a 24-hour change of -0.44%, SHIB shows promising signs. Currently trading around $0.00000716, it has a resistance of $0.00000832, indicating a potential gain of about 16.3%. The RSI stands at a neutral 40, suggesting neither overbought nor oversold conditions. The support level is placed at $0.00000640, serving as a safety net for any potential downturn.
BNB: Eyeing an 8.7% Rally
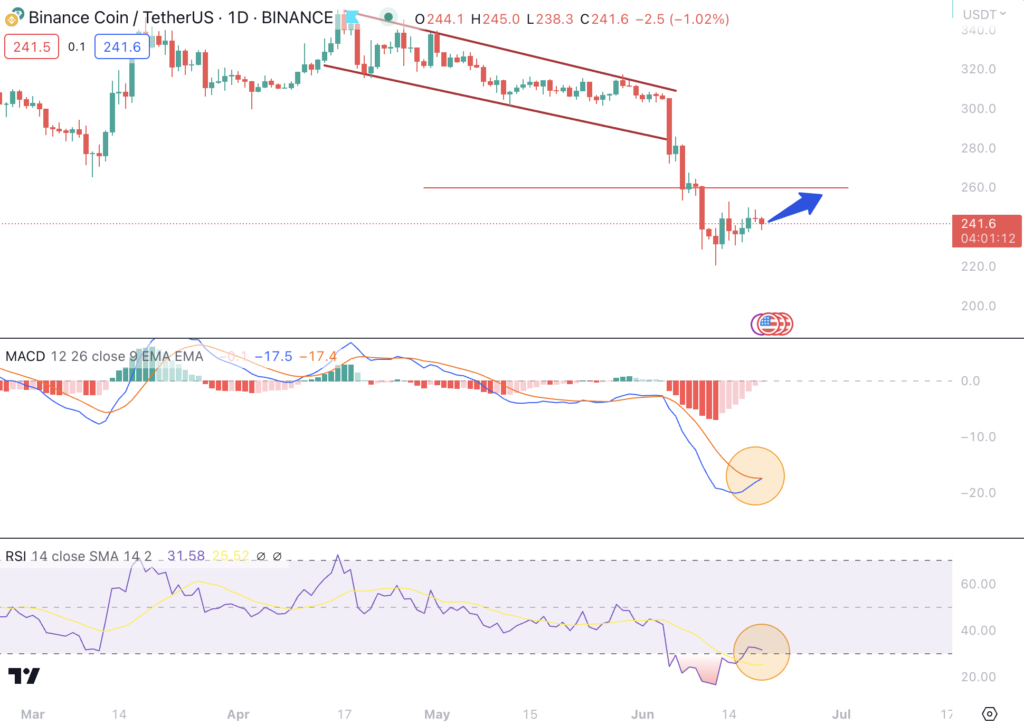
BNB’s current price stands at $241.12, with its resistance at $262, presenting an upside potential of 8.7%. Its RSI of 29 indicates oversold conditions, possibly signaling a rebound. Despite a 24-hour change of -1.2%, its support level at $220 provides a cushion against any further losses.

HBAR: On the Verge of an 11.1% Climb
HBAR is currently priced at $0.045, with resistance at $0.05, suggesting an 11.1% potential increase. A slight 24-hour dip of -0.4% doesn’t overshadow the potential, with the RSI at a neutral 38. Its support level is $0.038, establishing a potential base for any price drops.
ZEC: Gearing Up for an 18% Ascent?
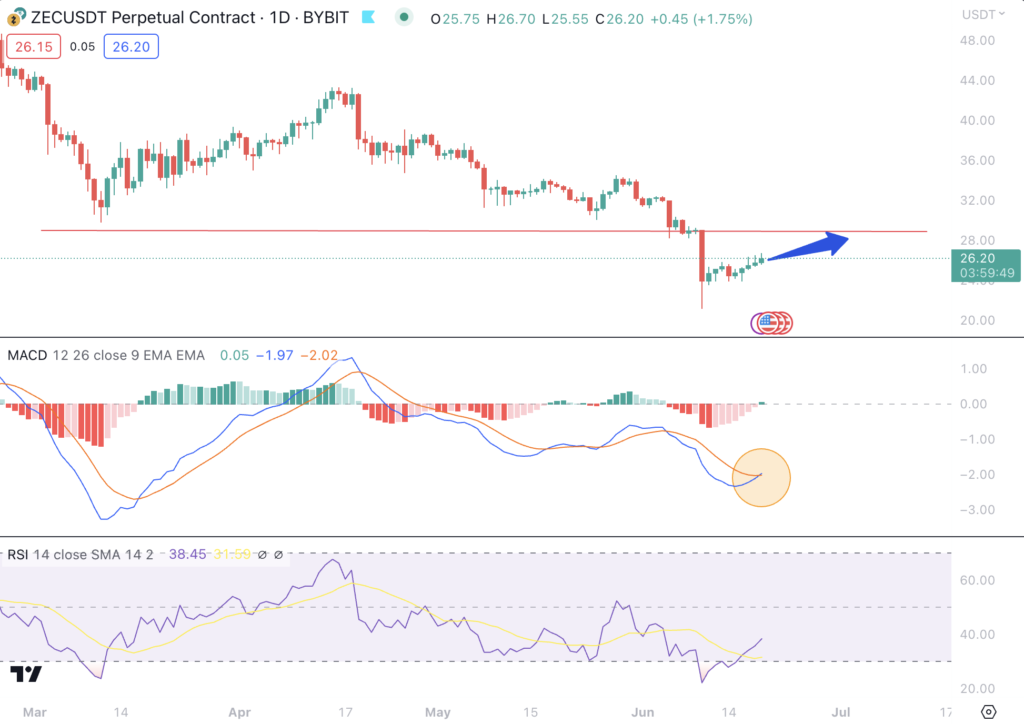
ZEC trades at $26.26 and eyes resistance at $31. An uptrend to this resistance would mean an approximate 18% increase. ZEC appears poised for growth with a positive 24-hour change of 1.4% and a neutral RSI of 37. The support at $24 further provides a safety net, indicating a favorable risk-reward ratio.

Wrap-Up
In conclusion, the world of cryptocurrency offers myriad opportunities for those with the right information at hand. Our analysis of SHIB, BNB, HBAR, and ZEC presents a compelling case for potential upside, driven by strong market indicators like MACD and RSI. While the inherent volatility of the crypto market always comes with risk, a thorough understanding of these trends can help to inform more strategic trading decisions.
Remember, while the numbers and trends are essential, the ultimate choice to buy or sell lies with the individual investor. Market indicators can provide significant insights, but they are not infallible. Always consider multiple sources of information, your personal risk tolerance, and financial goals when making investment decisions.
Stay tuned for future trading alerts as we continue to monitor and report on the dynamic landscape of cryptocurrency. Navigate wisely, trade strategically, and make the most of the market opportunities that come your way.