Amid a turbulent cryptocurrency market, a beacon shines through the storm: Tron (TRX). Tron has defied the odds and managed to sustain an uptrend across all time horizons, demonstrating the robust demand from buyers. While the journey isn’t without its moments of volatility, Tron has displayed good technical features that warrant a closer look. Let’s dive in.
About Tron (TRX)
Tron is a blockchain-based decentralized platform that aims to build a free, global digital content entertainment system with distributed storage technology and allows easy and cost-effective sharing of digital content. Tron was founded in September 2017 by a Singapore-based non-profit organization called the Tron Foundation. It is headed by CEO Justin Sun and has a dedicated in-house development team that includes renowned technology stalwarts.
Current Status and Indicators
Tron’s recent performance offers an exciting narrative for traders. Despite the overall market correction, this resilient asset has stayed within an uptrend, showcasing its strength and the sustained demand from buyers.
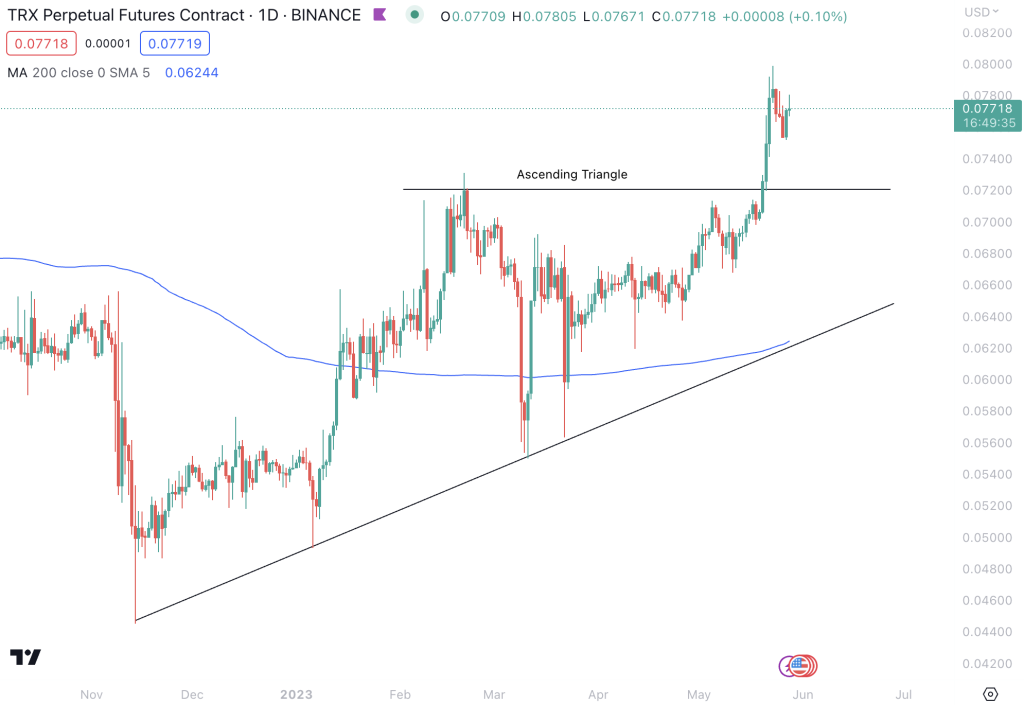
The price has recently broken bullishly out of an Ascending Triangle pattern, indicating a possible continuation of the uptrend. The Ascending Triangle is typically seen as a continuation pattern, suggesting the likelihood of the price breaking out in the direction of the existing trend. At this moment, Tron’s price has pulled back towards the $0.073-$0.075 support region after hitting an overbought RSI of about 80.
In terms of momentum, the situation appears bullish, albeit with some signs of inflection. The MACD line remains above the MACD signal line, and the RSI is currently above 55, both solid bullish signals. However, the declining MACD histogram bars suggest that momentum could weaken, warranting careful monitoring.
The Support and Resistance levels present some crucial landmarks on Tron’s current trajectory. The nearest support zone is at $0.073, previously a resistance level, followed by $0.065. On the other hand, the closest resistance zone stands at $0.080, with the subsequent one at $0.090.
Trade Setup
Given Tron’s robust uptrend and the recent pullback towards the $0.073-$0.075 support area, this could present an attractive entry point for swing traders eyeing an upside potential to $0.09. While it is critical to monitor the declining momentum, the price range still offers a solid trading range. Therefore, it’s a price alert to stay informed about significant price movements is advisable.
Summary
In the high-stakes world of crypto trading, Tron offers an exciting narrative. Despite a broader market correction, it has shown resilience and sustained an uptrend backed by solid buyer demand. Careful monitoring and strategic decision-making will be critical as Tron continues its journey. Traders are advised to look for changes in momentum and note crucial support and resistance levels. As always, it’s vital to have a risk management strategy in place and remember, the world of crypto trading is as unpredictable as it is exciting. Trade safe!