As cryptocurrencies continue to dominate the financial landscape, the need for intelligent tools that offer accurate, real-time insights has never been greater. To address this need, we have introduced a new feature that uses pattern recognition and machine learning algorithms to forecast crypto price trends. In this article, we delve into what this feature entails, how it can serve you, and the mechanics behind its calculations.
Pattern-Based Forecasts: A Detailed Look
You’ve probably heard the phrase “history repeats itself.” In the financial markets, this often holds true.
What has happened before will likely happen again, especially regarding price movement.
Our feature scans the historical data of different crypto tokens to find patterns or trends that have occurred in the past. Once it identifies a pattern, it looks for similar patterns to make an educated guess about what might happen next.
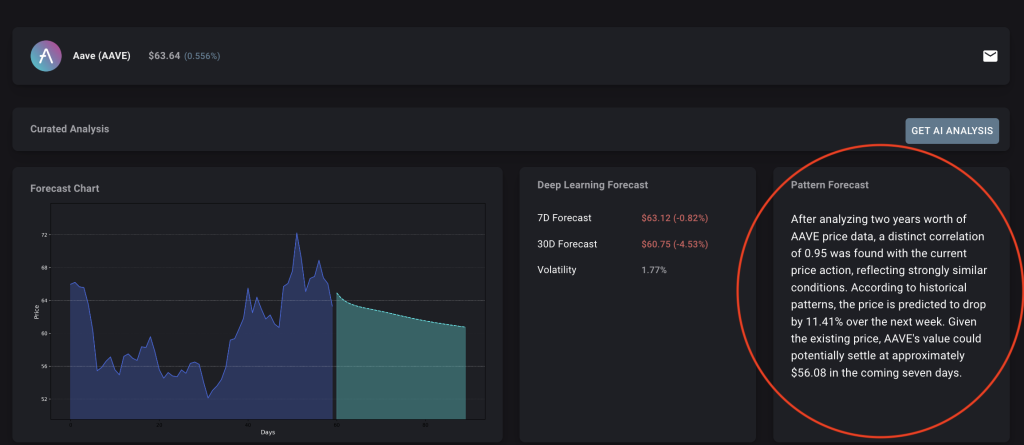
The important aspect is the following: We only consider patterns that correlate>95% with the latest price action. As a result, the forecast should get a high probability.
How It Can Help: Benefits for Everyone
Whether you’re a veteran crypto trader or a complete newcomer, this feature offers something. Here’s how:
Comprehensive Yet Understandable Analysis
If you’ve ever looked at a stock or crypto chart, you’ll know they’re full of ups and downs that might not make much sense at first glance. Our feature aims to make sense of this data for you. By analyzing these historical price movements, the tool provides you with a detailed yet easy-to-grasp overview of a token’s past, present, and possible future.
Forward-Looking Insights
We’re not just interested in what has already happened; we’re focused on what’s yet to come. The feature can forecast future price movements with the power of pattern recognition and LSTM networks. Imagine knowing the weather forecast before planning a picnic; you’d know whether to pack sunscreen or an umbrella. Similarly, understanding the likely future trends of a cryptocurrency can inform your investment decisions.
In summary, our feature aims to simplify the often intimidating world of crypto trading. Employing advanced algorithms and offering data in a visually appealing format enables both seasoned traders and newcomers to make informed decisions.
The Result
Lots of math and code — but finally, the result is pretty straightforward. We included an additional in our TokenSight function. In case we detected one or more pattern(s), you can simply read the summary of the related prediction.
How We Calculate: A Step-By-Step Guide
If you want to look behind the curtain, here’s a step-by-step explanation of how we calculate pattern-based forecasts.
Data Preparation and Scaling
Before diving into predictions, the first step is to prepare the raw financial data we collected. I
Our code uses a tool called “MinMaxScaler” to normalize various financial metrics like the ‘Close’ price (the last traded price when the market closes), ‘High’ price (the highest traded price during a period), ‘Low’ price (the lowest traded price), and ‘Open’ price (the first traded price when the market opens). By scaling these metrics between 0 and 1, we can ensure that they are on the same “scale” and can be easily compared and processed for predictions.
Sequence Creation
The next step is about creating sequences. You can think of a sequence as a pattern or a set of numbers that follow one another. For instance, in a dance routine, one move follows another in a specific sequence. These sequences are what feed into our prediction model. They serve as both the input and the “target” (what we want to predict).
Model Building and Training
Once the dance floor is set with our sequences, it’s time to train our dancer—the prediction model. This model has two primary layers:
- LSTM Layer: As we discussed earlier, this layer excels at understanding sequences or patterns.
- Dense Layer: This straightforward layer connects every input to every output, fine-tuning the predictions.
To train this model, we use an “optimizer” named Adam and a “loss function” called Mean Squared Error (MSE). Think of the optimizer as the dance instructor who corrects the model’s steps and the loss function as the scoring criteria.
Pattern Recognition
As a next step, we dive deep into the historical data to find patterns that resemble the most recent sequence or pattern. Think of it like a detective who looks at past cases to solve a current one. A pattern is considered “similar” if its correlation coefficient—a similarity measure—is above a certain level (0.95 in our default setting).
Percentage Change Calculation
Finally, we compute the average percentage change over a week for every similar pattern that our detective model identifies. In simpler terms, it’s like observing how much the temperature typically rises or falls after a sunny day and then predicting the next week’s weather based on this.
The function forecasts a cryptocurrency token’s likely closing price by understanding these calculations and pattern identifications.
Our forecasting feature blends machine learning, statistical analysis, and data visualization to provide an insightful and practical tool for crypto trading.
Summary
Our latest feature offers an exciting blend of pattern recognition and machine learning to provide realistic forecasts in the volatile landscape of cryptocurrencies. By seamlessly combining various data points and using advanced calculations, this feature tracks past trends and offers predictive insights, enabling smarter decision-making for everyone involved in crypto trading.
Whether you’re an amateur investor or a seasoned trader, this feature aims to offer something valuable by turning complex data into actionable insights.