Current Status – VeChain (VET) amidst Turbulence
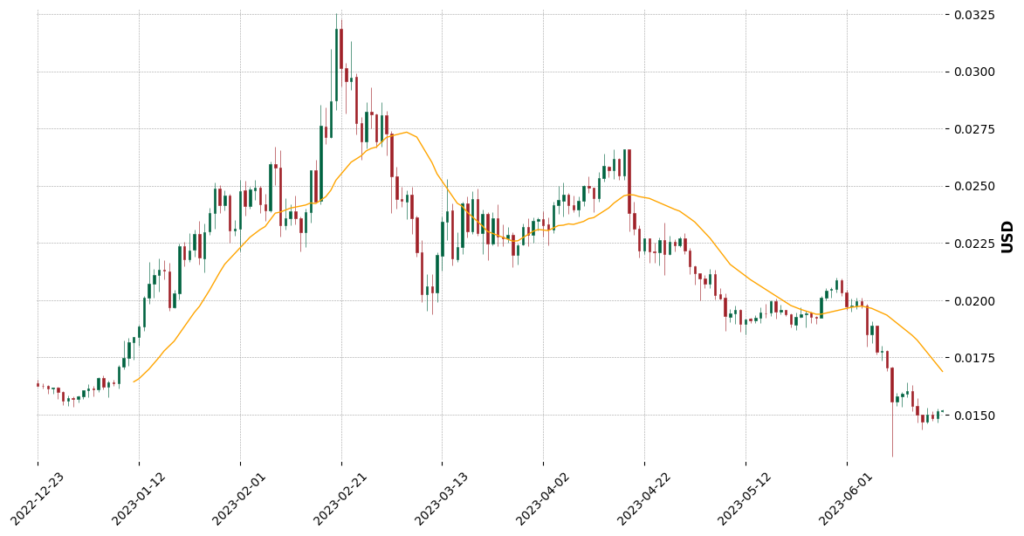
VeChain (VET) currently hovers at a trading price of $0.015. Over the past 24 hours, the token has witnessed a slight fluctuation, with a price change of 2%.
This cryptic play seems to be in the midst of a bearish breakout from a Falling Wedge pattern, indicating a confirmed downtrend. Despite this downward momentum, the price appears to be oversold, as indicated by its Relative Strength Index (RSI) hovering around 30.
The token is nearing a key support level of $0.015, suggesting the possibility of a bounce back in the short term. However, given the overall downward trend, potential investors should approach this trade setup with caution.
Regarding overall direction, VET exhibits a downtrend across all time horizons: short, medium, and long-term. As the token tiptoes around the $0.015 support zone, the nearest resistance zone is at $0.020, followed by $0.0225 and $0.027.
VeChain (VET) — Technical Indicators
Diving into the technical indicators, there’s a lot to unpack.
Starting with the moving average trends, the short-term Simple Moving Average (SMA) signals an uptrend, pointing toward a potential short-term recovery. However, the medium-term SMA also suggests an uptrend, slightly contradicting the overall downtrend observed. Conversely, the long-term SMA confirms the overarching bearish trend.
Moving onto the RSI, it sits at a neutral level of around 30. Despite the bearish sentiment, this suggests the token is oversold and could experience a price bounce soon.
The Moving Average Convergence Divergence (MACD), an indicator often used to identify potential buying or selling opportunities, is currently bearish. This implies that downward pressure exists, and the selling momentum may continue for a while.
The Ultimate Oscillator, another essential tool used to predict market reversals, supports the bearish outlook, indicating selling pressure in the market.
Lastly, the Average Directional Index (ADX), which measures trend strength irrespective of direction, is strong. This might suggest that the current downtrend is more likely to continue.

VeChain (VET) — Trade Setup & Outlook
Based on the aforementioned indicators and technical input, the immediate outlook for VET may appear gloomy, with a continued bearish trend. However, the oversold RSI coupled with the short and medium-term SMA uptrends indicates the potential for a price bounce soon.
This possible upward movement will be met with resistance at the $0.020 level, which, if breached, could extend to the subsequent resistance levels of $0.0225 and $0.027.
Nevertheless, given the strong ADX and the overall downward trend, investors are advised to tread carefully and set price alerts.
About VET – Unveiling the VeChain
VeChain (VET) is a blockchain-based platform known for its functionality in supply chain management and business process. The platform leverages tamper-proof and distributed ledger technology to ensure end-to-end transparency and provide high-speed value transfers. VET, VeChain’s native token, is used in transactions and as a store of value within the ecosystem.
CHAPTER 5: Summary of the Text – Unraveling VeChain’s Cryptic Course
To sum up, VeChain (VET) currently trades in a bearish trend, finding itself near a crucial support level of $0.015. Technical indicators portray a mixed picture, with short and medium-term SMA suggesting an uptrend and other indicators like MACD, oscillator, and ADX confirming a bearish momentum. The RSI, although neutral, leans towards an oversold state, hinting at a potential price bounce in the near term.
Potential price rebounds should not be ruled out despite the immediate bearish outlook. However, any price recovery will face resistance at $0.020, $0.0225, and $0.027 levels. Given the current market scenario and trends, it would be wise for traders to keep a close watch on VET’s price movements, remaining alert to seize any upcoming opportunities.
