Friends of the crypto sphere, gather around! In these turbulent times of heavy bleeding in the crypto market, we’ve been busy crunching numbers and analyzing data. We’re back with some exciting news: three tokens – WAVES, Ontology (ONT), and NEO – are flashing promising signs of short-term potential!
How We Analyzed The Tokens
Before we dive deep, let’s quickly brush up on the indicators we used for our analysis. This time around, we went all-in on the 4-hour chart, studying the Relative Strength Index (RSI), Ultimate Oscillator, Average Directional Index (ADX), Moving Average Convergence Divergence (MACD), Exponential Moving Average (EMA), Simple Moving Average (SMA), and Momentum (MOM).
These indicators helped us determine price direction, strength, momentum, and potential reversals.
Here’s some more information about the indicators. If you are already familiar with them, you can directly jump to the analysis below.
Relative Strength Index (RSI)
The RSI is a momentum oscillator used to measure the speed and change of price movements. It oscillates between zero and 100 and is typically used to identify overbought or oversold conditions in a market.
Ultimate Oscillator
This indicator combines short-term, medium-term, and long-term price action into one oscillator to avoid distortions these periods provide. It aims to capture momentum across different timeframes.
Average Directional Index (ADX)
The ADX is used to quantify the strength of a trend. A high ADX value indicates a strong trend, while a low ADX value suggests a weak or non-trending market.
Moving Average Convergence Divergence (MACD
The MACD is a trend-following momentum indicator that shows the relationship between two moving averages of a token’s price. It consists of the MACD line, signal line, and the MACD histogram.
Exponential Moving Average (EMA)
The EMA is a moving average that gives more weight to recent prices, making it quicker to respond to price changes than the simple moving average.
Simple Moving Average (SMA)
The SMA is calculated by averaging a token’s price over specific periods. It is used to identify trends by smoothing out the price data.
Momentum (MOM)
The momentum indicator compares the current price with a previous price (from a selected period) and displays the rate of change in the form of an oscillator. It’s used to identify the speed at which the price is changing.
Technical Analysis
WAVES
About WAVES
WAVES is the native token of the Waves platform, an open-source blockchain platform developed by the Waves Technology company.
The Waves platform is designed to make it easy for users to create their own custom tokens and decentralized applications (dApps). The WAVES token itself is used for standard Waves network transactions, token creation, and as a base currency for the Waves DEX (decentralized exchange).
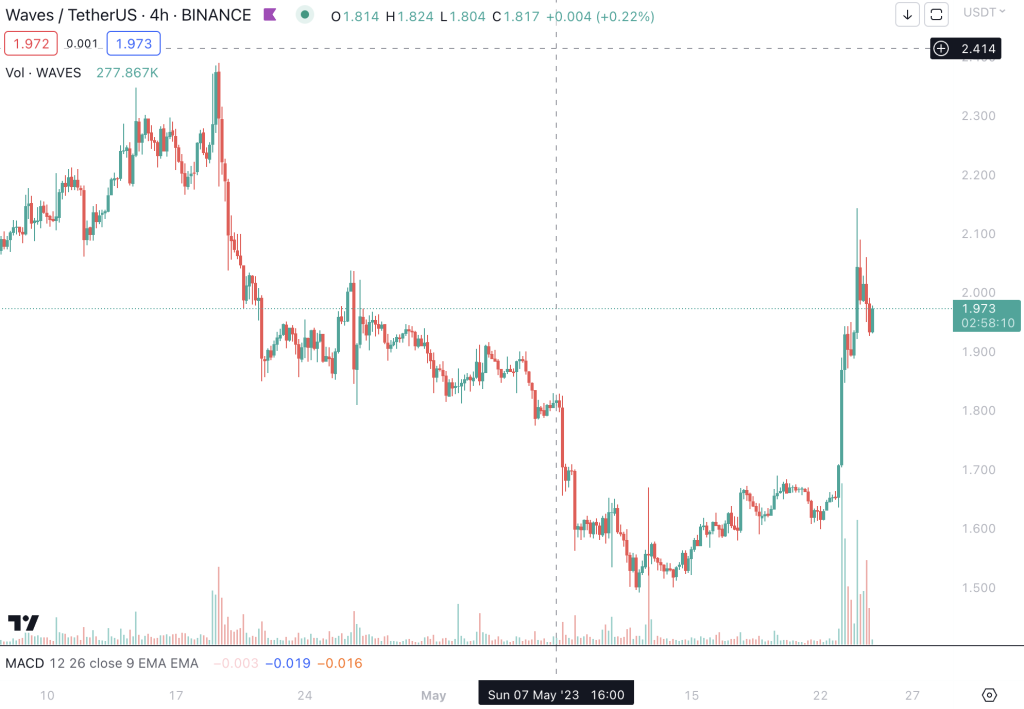
WAVES Chart
Analysis
Despite the current tumultuous market, our very own WAVES is showcasing a resilience that warrants our attention. The bearish ultimate oscillator could easily mislead one, but this seems to be merely a façade. Digging deeper, we uncover significant bullish signals that paint a different, more promising picture.
The ADX, a robust measure of trend strength, is glowing with bullish vigor. A bullish MACD, an influential trend-following momentum indicator, further reinforces this solid indication. As the MACD line crosses above the signal line, it shows the market sentiment is shifting toward buying, a reassuring sign for WAVES enthusiasts.
Adding to this bullish narrative is the Momentum (MOM) indicator. It illustrates the rate of change in WAVES’ price is positive, indicating a burgeoning bullish momentum. This momentum is echoed in both the SMA and EMA, with the exception of the ultra-long-term readings (100 and 200), which suggests a short to mid-term bullish trend.
However, let’s not overlook the RSI, which is currently showcasing a neutral stance. Although this might seem lukewarm, it’s beneficial as it indicates WAVES isn’t overbought; therefore, there’s room for more investors to enter without the risk of immediate overselling.
As of now, WAVES is cruising at $1.96, but given the bullish indicators, we’re setting our sights higher. We foresee a journey upward to an initial target of $3. In these challenging times, the signs we see from WAVES are not just comforting; they’re promising, giving us a wave of optimism in the current market turbulence. Keep your eyes on WAVES; it’s ready to make a splash!
ONTOLOGY (ONT)
About ONT
Ontology is a high-performance public blockchain and distributed collaboration platform. Launched by Chinese company Onchain in 2017, Ontology provides a flexible and customizable platform that supports a wide range of real-world applications.
Its aim is to provide businesses of all sizes with the means to design their own blockchain systems without requiring extensive knowledge in blockchain technology. The ONT token is used within the Ontology ecosystem for various network operations.
ONT Chart

Analysis
At a casual glance, Ontology might be mistaken for the sleeping giant of the crypto market. With its neutral RSI and bearish MACD, it exudes a certain air of calm, almost as if it’s biding its time. But we all know that appearances can be deceiving.
The RSI, teetering in the neutral range, does not suggest that Ontology is oversold or overbought. This can be seen as a good omen, allowing room for more buyers to enter the market, without immediately driving it into overbought territory. In other words, ONT could still invite more investors on board without triggering an instant sell-off.
While the MACD might be flashing a bearish signal for now, indicating that sellers are temporarily in control, it’s important to remember that the crypto market is nothing, if not volatile. These bearish periods are often fleeting and can swiftly swing back towards bullish momentum, particularly in a token like Ontology with strong fundamentals.
This belief is reinforced when we consider all the other indicators. Each of them is ardently hoisting the bullish flag, signaling that Ontology might be preparing to break free from its apparent tranquility. ONT seems like a coiled spring, compressing and gathering energy, ready to propel itself toward bullish territories.
Currently, Ontology is trading at a humble $0.23. However, given the cluster of bullish indicators and its potential for upward movement, we’re setting our target at a notably higher $0.35. In a largely painted red market, Ontology seems to have more going on beneath the surface than you might initially think. This crypto giant might just be waking up. Keep an eye on ONT; it might just surprise us!
NEO
About NEO
NEO, often referred to as “China’s Ethereum”, is a blockchain platform for the development of digital assets and smart contracts. NEO’s vision is to build a “smart economy” by integrating digital assets, digital identities, and smart contracts into its platform.
The NEO token represents ownership of the NEO blockchain and allows users to participate in network management, such as voting for bookkeeping, and receive GAS tokens, which are used to pay for operations and services on the NEO network.
NEO Chart

Analysis
Prepare for the grand reveal: the cryptocurrency that seems to be the embodiment of optimism and potential – NEO! NEO’s indicators paint a picture that would captivate any crypto enthusiast. With a neutral RSI, a bullish ultimate oscillator, a bullish MACD, bullish SMAs and EMAs, and bullish momentum, NEO stands as a beacon of bullish hope in a stormy market.
The neutral RSI demonstrates that NEO has hit a balance, an equilibrium between buyers and sellers that leaves room for growth. It’s a beneficial position, as it indicates NEO isn’t overbought and has the potential to attract more buyers without triggering an immediate sell-off.
The Ultimate Oscillator flashes a bullish signal, suggesting that the buying pressure is building across short, medium, and long-term time frames. This bullish outlook is further supported by a positive MACD, signaling that the sentiment is shifting towards buying, implying a strong upward momentum may be on the horizon.
Looking at the SMAs and EMAs, NEO seems to be on a roll. Except for the ultra-long-term readings (100 and 200), all are trending bullish, suggesting the price momentum is leaning toward the upside. And let’s not forget the Momentum indicator, which is also signaling bullish, meaning NEO’s price changes are picking up speed in the positive direction.
Trading at a sturdy $10, NEO is poised to make a leap. Factoring in these bullish indicators, we’re setting our sights on an ambitious first target of $15. The signs are encouraging and suggest NEO is embarking on a thrilling upward journey. In these challenging market conditions, NEO seems to be the ray of sunshine offering promising short-term potential. Keep a keen eye on NEO because it’s ready to ascend!
Wrap-Up
In the midst of market turbulence, it’s encouraging to see the gleaming potential in WAVES, Ontology, and NEO. With its unique qualities and bullish indications, each of these tokens brings a wave of optimism to the crypto trading scene. Our analysis suggests these are the short-term coins to watch out for.
Despite a bearish ultimate oscillator, WAVES is riding high on a sea of bullish indicators. Ontology appears to be gathering momentum for a notable climb during the seeming calm. NEO, the jewel in the crown, presents a strikingly bullish outlook, teasing a thrilling ascension.
Remember, even though these tokens seem primed for short-term gains, the cryptocurrency market is an inherently volatile one. It’s crucial to do your research and consider all factors before making investment decisions. Keep your strategies flexible, your mind open, and your eyes on these tokens – they’re ready to make some noise!
This concludes our exciting exploration into WAVES, Ontology, and NEO’s potential. Until next time, stay tuned and happy trading!