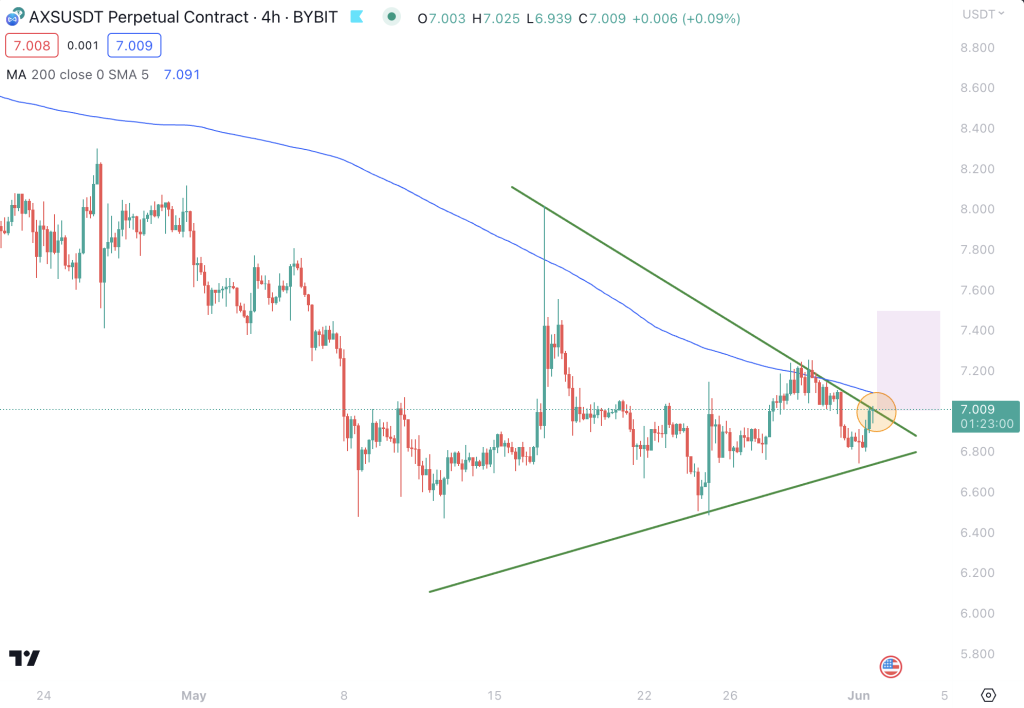
Axie Infinity (AXS) is currently in a fascinating state. Trading at around $7, the digital token has been consistently trading sideways in a narrow range between $6.60 and $7.30 throughout May.
Despite this seeming tranquility, a crucial technical development is unfolding on the charts. A triangle formation, a technical pattern often preceding significant price movement, is nearing its apex. Interestingly, AXS appears on the brink of breaking this triangle to the upside. If this happens, it could potentially catalyze a rally to $7.3 and, should the broader market provide sufficient support, possibly even to $7.5.
AXS — Indicators Analysis
In terms of the technical indicators, the situation is somewhat mixed. The Ultimate Oscillator, a technical analysis tool used to measure market momentum, is flashing bullish signals. This suggests the buying pressure could soon exceed the selling pressure, potentially contributing to the expected upward breakout.
However, two other essential momentum indicators, the Moving Average Convergence Divergence (MACD) and Momentum (MOM) indicators, are currently bearish. This indicates that despite the bullish signals from the Ultimate Oscillator, there is still significant downward pressure in the market.
The picture becomes even more nuanced when we look at the Simple Moving Average (SMA) and Exponential Moving Average (EMA) indicators. Both signal neutrality in the short term, suggesting a balance between buyers and sellers. However, the medium and long-term SMAs and EMAs lean bearish, indicating that AXS has experienced a downward trend over these longer timeframes.
Finally, the Relative Strength Index (RSI), an oscillator that measures the speed and change of price movements, is currently neutral. This suggests that the recent price changes in AXS have not been particularly pronounced, and there is not an overwhelming amount of buying or selling pressure.
AXS — Outlook & Potential Trade Setup
Given the current technical setup, traders should closely monitor the triangle formation on the AXS chart. If it breaks to the upside, as the Ultimate Oscillator suggests, it could provide a bullish scenario with a potential rally to $7.30 as the first goal. In the case of broader market support, traders can aim for a second goal at $7.50
Setting an alert for this potential breakout is recommended to avoid missing this trading opportunity.
However, traders should also prepare for the alternative scenario. If the broader cryptocurrency market continues to exhibit bearish sentiment and the potential breakout is rejected, we could see AXS decline to the $6.4 – $6.3 range as a first step. As always, monitoring the market for any changes and adjusting trading strategies accordingly is crucial.
About AXS
Axie Infinity (AXS) is a digital token native to the Axie Infinity platform. This Ethereum-based game allows players to breed, raise, and battle fantasy creatures called “Axies.” The AXS token has a dual function in the Axie Infinity ecosystem. It acts as a governance token, giving holders the right to vote on certain development decisions, and a utility token, allowing players to interact with the game.
Axie Infinity has gained significant attention as one of the most prominent names in the play-to-earn movement, where players can earn tokens and other rewards through their gameplay. As the digital economy grows, the potential for AXS and similar tokens could be significant, making its price movements a matter of interest for traders and investors alike.
Summary
Currently, Axie Infinity (AXS) is poised at a critical juncture. As it nears the apex of a triangle formation, the possibility of an upward breakout presents an exciting opportunity. Should this occur, we could witness a rally to $7.30 and potentially $7.5, representing an upswing of approximately 7%. However, traders must remain vigilant and monitor for potential rejection.
If the broader market continues to favor bears, AXS could decline to the $6.4 – $6.3 range. Despite the mixed signals from various indicators, the bullish indication from the Ultimate Oscillator presents an optimistic viewpoint. Nevertheless, traders must watch the market closely and adjust their strategies as necessary.