Buckle up because we’ve got a treat for you today. Amidst all the turbulence in the crypto markets, one token is catching our eye—a possible phoenix rising from the ashes, you might say. Yep, we’re talking about Chiliz (CHZ), the leading digital currency for sports and entertainment!
The CHZ Landscape: Quick Numbers
Chiliz has seen a mixed bag of performance lately, with a 2.05% gain over the last week but a 4.11% dip over the past month. Over the last year, the token has plummeted by a whopping 66.61%. Currently, it’s skimming close to its 1-year low at $0.0545. But here’s the kicker: based on our pattern forecast, we’ve detected signs that Chiliz may be setting the stage for a dramatic reversal!

Could Historical Patterns Signal a Surge?
Now, I know what you’re thinking. “The indicators are mostly bearish, so what’s the deal?” We’ve crunched two years of CHZ’s price data and found something incredibly intriguing. There are five comparable patterns with a jaw-dropping 0.97 correlation to current price action. And guess what? These patterns suggest an “infinite” price surge in the next week. That’s right—infinite! Could this mean we’re on the cusp of a major upward rally?
→ Quick Tip: Don’t Skip This CHZ Opportunity—Set Your Trade Alerts Now!
Resistance and Support: The Crucial Battle Lines
Currently, Chiliz has established key support at $0.054, and resistance levels are seen at $0.066 and $0.085. Do some quick math, and you’ll find that a break beyond the second resistance line could lead to a significant 57% jump from the current price. In a market where triple-digit gains can happen overnight, 57% is nothing to sneeze at!
Trending: Are the Winds Changing?
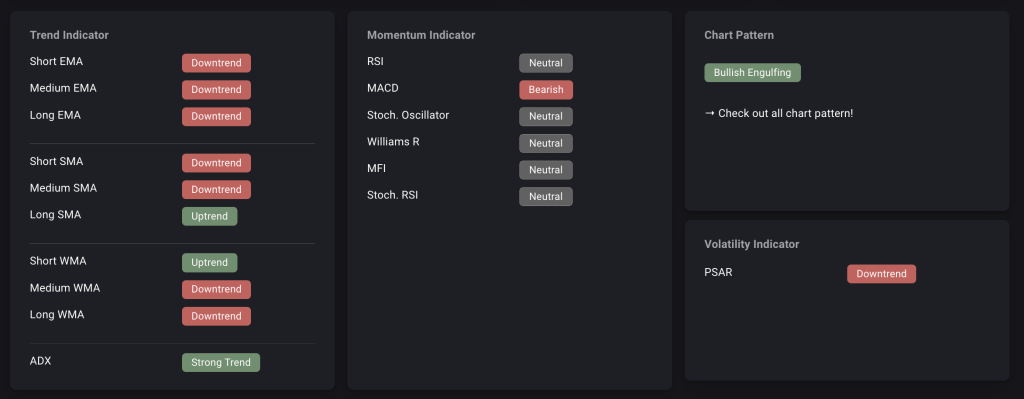
Even a glance at the trend indicators might discourage you. Short, Medium, and Long EMAs are pointing downward, along with several other indicators. But, and it’s a big BUT, the Long SMA and Short WMA are showing uptrends. Plus, the ADX is indicating a strong trend. This odd mix could be the confusion before the clarity, a potential calm before the storm.
Momentum Indicators: A Mixed Bag with Potential
The Relative Strength Index (RSI), Money Flow Index (MFI), and the other momentum indicators are all neutral. This suggests that the sell-off might have reached its exhaustion point. When indicators are neither oversold nor overbought, a sharp move in either direction becomes more probable.
Bullish Engulfing: A Ray of Light?
Perhaps one of the most exciting aspects of the Chiliz technical analysis is the “Bullish Engulfing” chart pattern. This pattern usually indicates a potential reversal, and in the context of the historical data, this could be the fuse that ignites the rally.

So, What’s the Trading Game Plan?
If you’re a day trader, consider the following:
- Ideal Entry Point: At or near the current price of $0.054
- Stop-Loss: A tad below support, say $0.053
- Profit Target: Shoot for a profit close to the first resistance level, around $0.066
For those planning to HODL:
- Dollar-Cost Averaging: Especially if the price moves close to the yearly low
- Stop-Loss: Keep it snug near the support
- Long-Term Goals: Look for consistent breakouts above the $0.066 and $0.085 resistance levels
The Bottom Line
We’re on the edge of our seats with this one, folks! The indicators might seem gloomy, but historical patterns strongly suggest that Chiliz could be at a major turning point. If the token can breach the second resistance level, we could see a remarkable 57% surge.
Keep in mind, however, the world of cryptocurrency is rife with volatility and risk. This isn’t financial advice but merely an analysis based on current data and historical patterns. Always do your due diligence and consider your financial situation carefully.
So, are you ready to jump on this Chiliz train before it leaves the station? Let us know in the comments below!
Your Next Step(s)
→ Check out the CryptoKnowledge for more Chiliz details & data
→ Start trading Chiliz