Today, we will take a close look at Ethereum (ETH), the blockchain that needs no introduction.
From hosting decentralized applications to being the cornerstone for most of DeFi, Ethereum is a marvel in the crypto universe.
But for all its technological prowess, Ethereum’s future price trends are a puzzle we must solve. So, let’s dive into it.
→ Set up a trade alert for ETH
Ethereum — The Two Faces of Forecasting
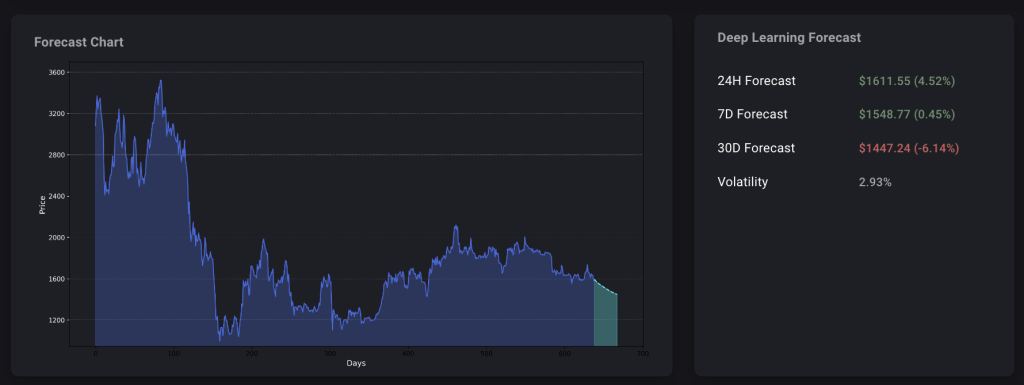
Price forecasts are a double-edged sword. On the one hand, the 24-hour forecast for Ethereum is relatively optimistic. We’re talking about a potential 3.8% hike to a price of $1611.55. Yet, the future doesn’t seem as bright as we extend the timeframe. The 7-day forecast expects a minimal drop of 0.25%, and the 30-day projection is more unsettling, with a 6.79% fall to around $1447.24.
Ethereum — Trend Indicators
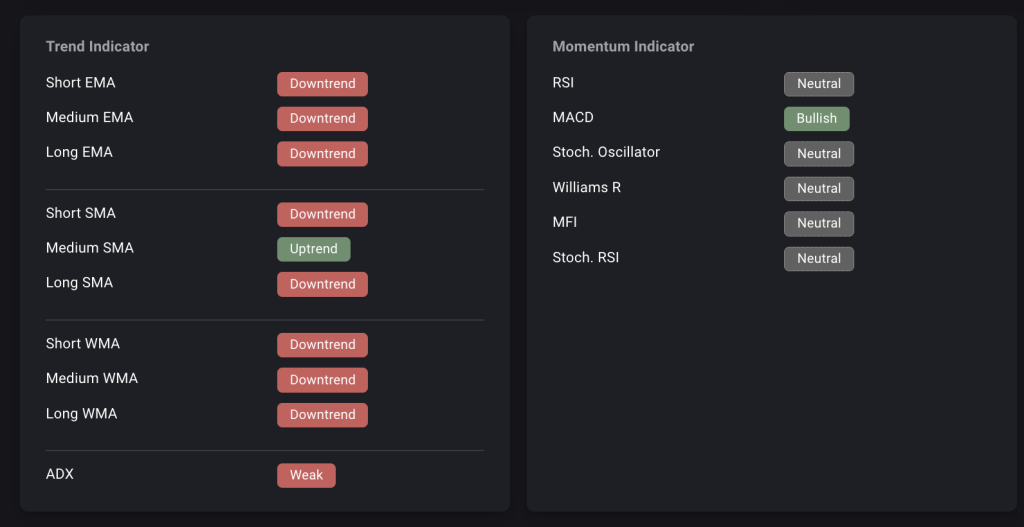
For those of you who are new to the trading world, trend indicators are invaluable tools that help investors understand market sentiment. Regarding Ethereum, most of these indicators, like the EMA, SMA, and WMA, point downward.
That’s usually a red flag for any asset, crypto or otherwise. It’s like when your favorite TV show starts having filler episodes; you know it’s not a good sign.
Closer Look At Momentum Indicators
Now, let’s talk about momentum indicators.
With a neutral RSI but a bullish MACD, it’s almost as if Ethereum gives us mixed signals. Think of it as a complex piece of music with abrupt tempo changes. While it can be aesthetically appealing, dancing to is a nightmare unless you know the steps.
For those who believe in the storytelling power of charts, the appearance of the “Three Black Crows” pattern in Ethereum’s chart is akin to ominous dark clouds gathering before a storm. Generally, it’s considered a bearish indicator, and it’s worth paying attention to.
Wrap-Up
- 30-Day Forecast: The deep learning models predict a potential drop of 6.79% in Ethereum’s price, possibly bottoming out at $1447.24. This is a critical figure for traders and investors alike.
- Volatility: At 2.93%, Ethereum’s volatility isn’t to be ignored. While it presents opportunities for high rewards, it also brings high risks—something every investor should weigh carefully.
- Trend Indicators: Most indicators like EMA, SMA, and WMA are pointing to a downtrend, which aligns with the 30-day forecast. Even though the MACD suggests bullishness, it’s essential to consider all indicators collectively.
- Momentum Indicators: The RSI, Stochastic Oscillator, and other momentum indicators are neutral, neither confirming nor denying the predictive models but serving as additional tools for making an informed decision.
In summary, while Ethereum has been a stalwart in the crypto world, the current indicators and 30-day forecast suggest caution. Whether you’re considering entering the market or pondering an exit, these insights aim to guide your decisions during this unpredictable period.
Your Next Step(s)
→ Check out the CryptoKnowledge for more ETH details & data
→ Start trading ETH