With today’s crypto analysis, we look into an often underrated token: Stellar (XLM). Similar to our other analysis, we closely examine chart performance and technical indicators. On top of that, we try to derive a trade recommendation for the month ahead. So, let’s dive right into it!
Check out our latest article about Ethereum and Bitcoin
→ Ethereum’s September Analysis: Key Insights and Trade Recommendations
→ Bitcoin Price Update: Your Week-Ahead Outlook Unpacked!
XLM Analysis — Overview
In the volatile cosmos of cryptocurrencies, Stellar (XLM) is currently in the spotlight, demonstrating a relatively mixed performance that warrants a detailed analysis. Currently priced at $0.126 with a slight increase of 2.02% (24h), it poses a noteworthy discussion on its potential trajectory.
Price Performance: A Mixed Bag
In recent times, Stellar has exhibited a notable fluctuation in its price performance.
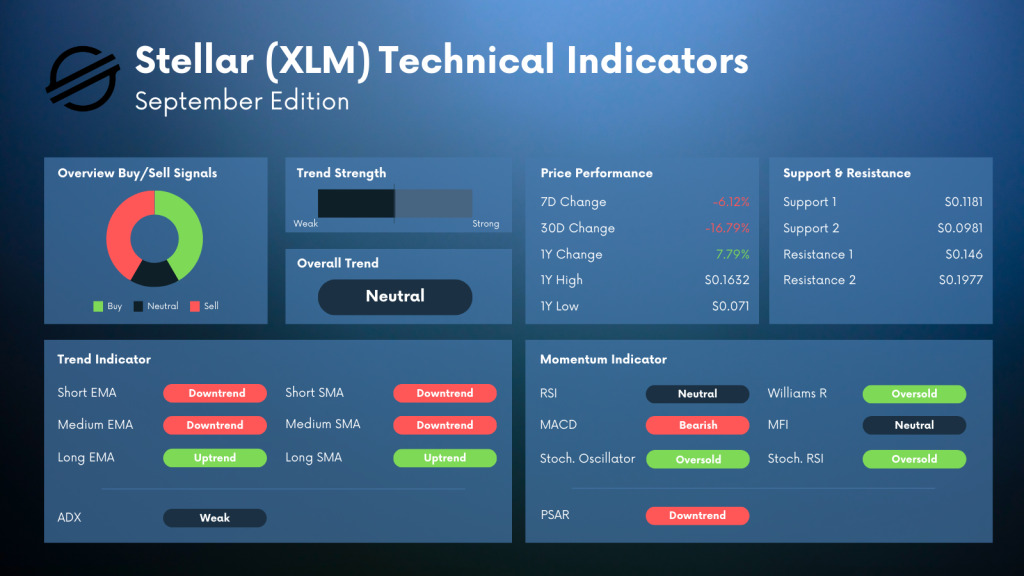
- The weekly change stands at a decline of 6.12%
- During the last month, XLM observed a more pronounced dip of 16.79%
- However, when viewed from a broader perspective, XLM managed to secure a positive annual change of 7.79%.
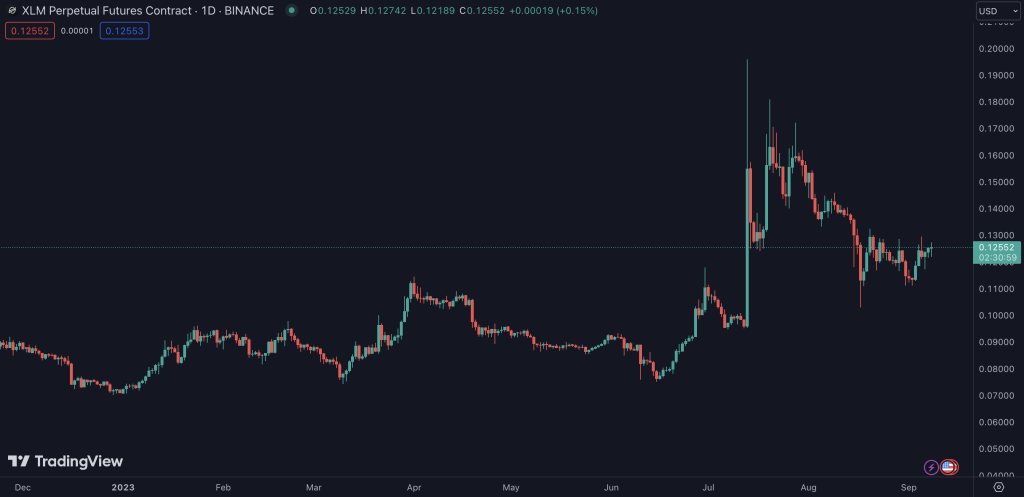
The yearly journey of Stellar reveals a high of $0.1632 and a low point of $0.071, depicting the potential for volatility and possibly highlighting opportunities for discerning investors.
When looking at the chart, the peak in July calls for attention immediately. XLM pumped almost 100% and was able to maintain a significantly higher level. After loosing some ground, the token seems to consolidate at the 0.12 level right now.
XLM — Trend Analysis: A Time of Flux
XLM is navigating through a period characterized by weak trend strength, which may signify a state of flux or a potential period of market adjustment. This may also underpin the above statement about the consolidation. The trend indicators present a varied picture:
EMA & SMA
A closer look at the EMAs and SMAs indicates contrasting short and long-term trends. While the short and medium-term indicators signal a downtrend, the long-term metrics hint at an uptrend, suggesting a period of market recalibration.
ADX
Aligning with the overall weak trend strength, the ADX currently represents a weak trend, indicating a potential period of lesser volatility and subdued momentum.
More about Stellar (XLM)
→ 4 Reasons Why XLM Has The Potential For Another 15% Surge!
→ Analysis of XRP, XLM and THETA on 9th June 2023
→ XLM: Charting a Potential 40% Upside Amid a Falling Wedge Pattern
XLM — Momentum Indicators Analysis: An Oversold Territory
XLM’s momentum indicators largely portray it as being in an oversold territory.
The Stochastic Oscillator, Williams R, and Stochastic RSI all indicate oversold conditions, which might signal upcoming opportunities for investors. However, a neutral RSI and MFI suggest a balanced market condition, although the MACD hints at a bearish sentiment.
Furthermore, the PSAR, being in a downtrend, signals potential downward pressures, urging investors to remain cautious and observant of market trends.
Overall, the momentum indicators do not print a clear picture.
Trade Recommendation
At the current level, providing a clear trade recommendation is complex. However, we favor a bullish scenario based on the oversold indicators and the bounce from the 0.113 level at the beginning of August and the beginning of September.
Nevertheless, we consider it too early to enter a long position. Instead, we suggest waiting until the short-term moving averages or the MACD turns bullish. Together with the current chart action and the oversold indicators, it would create a high probability of an upswing scenario.
However, a break of the support at $0.113 to the downside would initiate a further downtrend to the level of $0.094.
Stellar (XLM): Navigating the September Waters – Final Thoughts
As we journey further into September, Stellar presents itself as a case of complex narratives. The weak trend strength and neutral overall trend hint at a period of market stabilization. However, the contrasting indicators suggest that investors should maintain a vigilant yet hopeful approach.
With signs of potential recovery juxtaposed against bearish indicators, adopting a cautious yet flexible strategy may be key in leveraging the opportunities XLM seems to hint at. As always, investors should closely monitor market trends, ready to adapt their strategies according to the evolving market dynamics.
Your Next Step(s)
→ Check out the CryptoKnowledge Platform and enhance your trading skills
→ Start trading XLM