
We examine three prominent tokens in today’s crypto roundup – EOS, Ethereum (ETH), and Polkadot (DOT). All three coins have been caught in a short-to-medium-term downtrend, marked by minor fluctuations in price and mixed signals from key indicators. However, each tells a unique story, offering an intriguing insight into the complex dynamics of the crypto market.
EOS – A Struggle to Gain Momentum
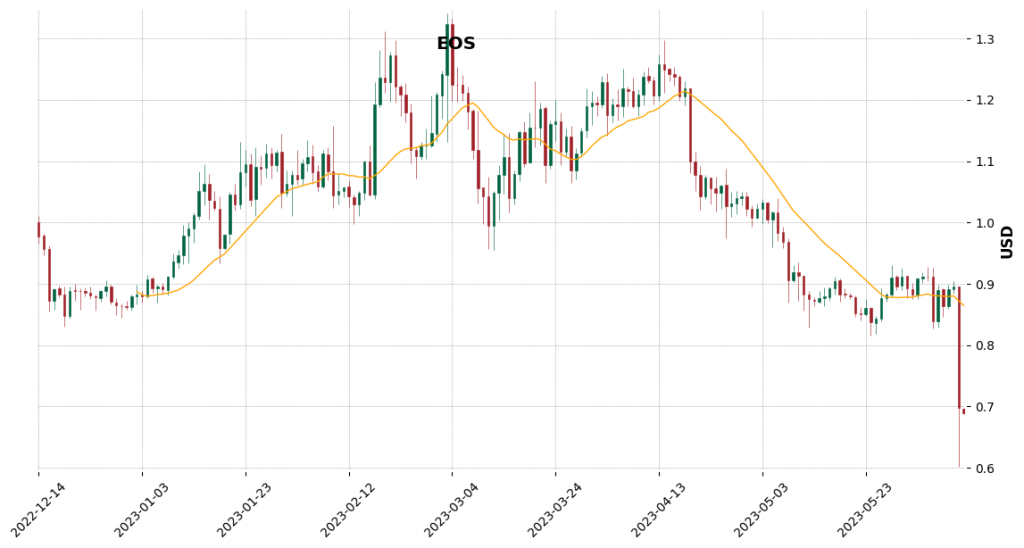
Currently trading at $0.688, EOS has experienced a minor slip of 1.31% in the last 24 hours. Despite the downtrend evident across the short, medium, and long-term, the Moving Average Convergence Divergence (MACD) presents a bullish outlook.
It implies underlying positive momentum that could potentially result in a price recovery in the near future. The Relative Strength Index (RSI) remains neutral, balancing buying and selling pressures. The strong ADX reinforces the bearish trend, highlighting the market’s strong sentiment for EOS.
ETH – Ethereum: The Long-Term Bull Amid Short-Term Bears
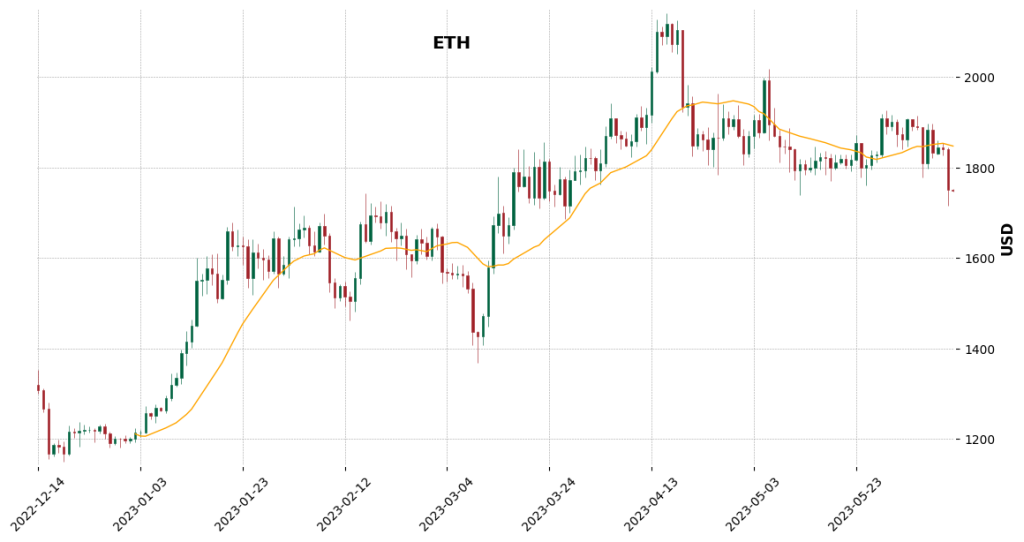
Ethereum (ETH) stands out as an interesting case with a long-term uptrend despite short and medium-term downturns. Currently priced at $1,764, ETH experienced a slight gain of 0.72% over the past 24 hours. Despite this upward price movement, the MACD indicates a bearish signal, suggesting Ethereum might experience further price dips before a potential uptrend.
Like EOS, ETH’s RSI is also neutral, meaning a state of equilibrium between the buyers and sellers. The weak ADX score reflects a lack of strength in the current trend, reinforcing the possibility of a trend reversal or consolidation period in the near future.
DOT: Strong Bearish Undertow With Bullish Undertones
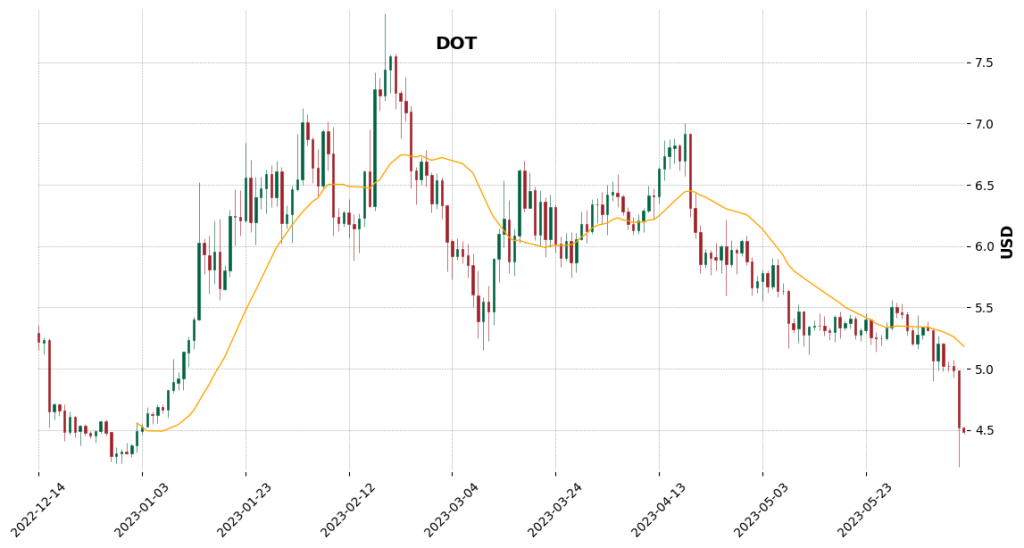
Polkadot (DOT), trading at $4.50, presents a similar narrative to EOS, featuring a slight price decrease of 0.31% in the last 24 hours amidst a general downtrend. However, as with EOS, the MACD projects a bullish outlook, suggesting a potential break from the prevailing bearish sentiment.
The neutral RSI underscores the balance in the current market demand, while the strong ADX reading underscores the strength of the ongoing bearish trend. Despite the downturn, the bullish MACD hints at potential price resilience and possible recovery for DOT.
Summarized — A Complex Landscape with Hints of Bullish Resurgence
The crypto market remains as complex and volatile as ever. The current downtrends across EOS, ETH, and DOT suggest a bearish market sentiment. However, the bullish signals from the MACD indicators for EOS and DOT, coupled with ETH’s long-term uptrend, provide a glimmer of hope for a bullish resurgence.
Despite the mixed signals, the neutral RSI for all three tokens indicates a potential for market equilibrium and price stabilization in the coming days. As always, these tokens require close observation for investors to navigate their next moves effectively.