
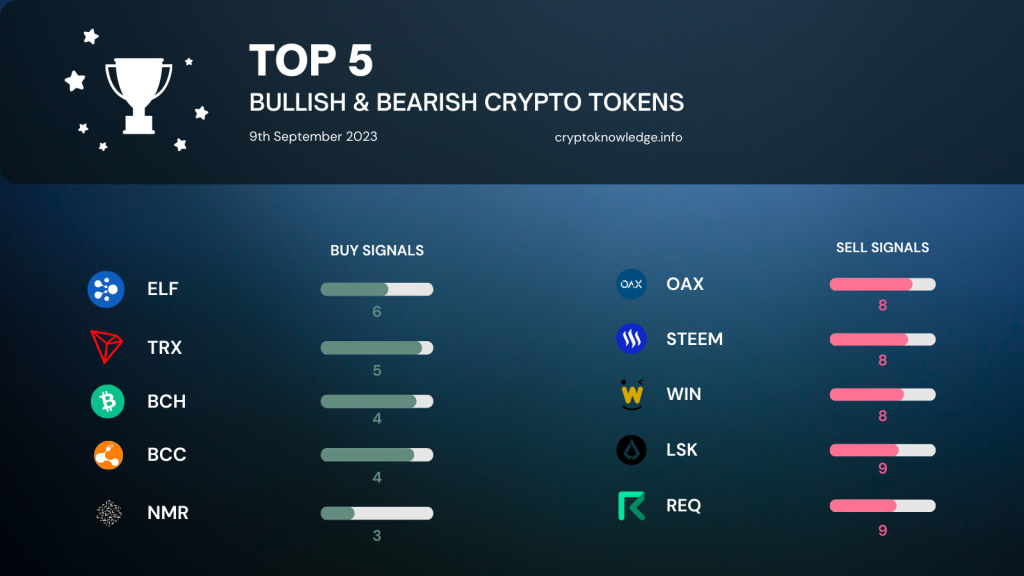
Here’s today’s edition of the Top Bullish and Bearish tokens. Again, we analyzed more than 100 crypto tokens according to nine technical indicators. An here’s the result: The tokens with the most buy and sell signals according to the analyzed indicators.
Top Bullish Crypto Tokens
aelf (ELF) — 6 Buy Signals
Despite bearing a bearish MACD, ELF predominantly showcases an uptrend, as evidenced by its consistent growth across both exponential and simple moving averages (EMA & SMA). The RSI and stochastic oscillator markers remain neutral, offering no definitive direction at this juncture.
Tron (TRX) — 5 Buy Signals
TRX mirrors ELF’s bearish MACD outlook, accompanied by a series of uptrends noted across its EMA and SMA indicators. The stochastic RSI hints at an overbought situation, necessitating careful observation in the coming days.
Bitcoin Cash (BCH) — 4 Buy Signals
The BCH token maintains an uptrend across most parameters, with a neutral stance in RSI and money flow index (MFI). However, an overbought signal in the Williams %R and stochastic RSI indicators may suggest potential retracements ahead.
BitcConnect (BCC) — 4 Buy Signals
Much like its counterparts, BCC continues to exhibit a bullish momentum despite a bearish MACD. The overbought status as indicated by Williams %R and stochastic RSI could be a harbinger of forthcoming market corrections.
Numeraire (NMR) — 3 Buy Signals
NMR presents a mixed bag of indicators with a bearish MACD and an overbought stance in RSI, stochastic RSI, and MFI. The latter might indicate a saturated buying activity, pointing to potential volatility.
Top Bearish Crypto Tokens
OAX (OAX) — 8 Sell Signals
The OAX token is amid a significant downtrend, a sentiment echoed across its EMA and SMA profiles. Despite the bearish outlook, the stochastic oscillator indicates an oversold condition, hinting at possible opportunities for market entry.
Steem (STEEM) — 8 Sell Signals
With a consistent downtrend evidenced across most parameters, STEEM grapples with market pressures. The neutral readings on the stochastic oscillator and Williams %R imply a period of market consolidation may be on the horizon.
WINkLink (WIN) — 8 Sell Signals
Akin to STEEM, the WIN token is undergoing a marked downtrend. Investors should tread carefully, with a keen eye on the MACD for potential signs of recovery in the forthcoming sessions.
Lisk (LSK) — 9 Sell Signals
LSK presents a severely bearish outlook, dominated by a consistent downtrend across various indicators. An overbought condition in stochastic RSI may suggest a brief respite or potential reversal in the coming days.
Request (REQ) — 9 Sell Signals
REQ mirrors LSK’s bearish demeanor, with all moving averages indicating a continued downtrend. The overbought stance in the stochastic RSI suggests that caution should be exercised, anticipating potential market fluctuations.
Detailed Data
Top 5 Bullish Crypto Tokens
| Indicator | ELF (Rating: 6) | TRX (Rating: 5) | BCH (Rating: 4) | BCC (Rating: 4) | NMR (Rating: 3) |
|---|---|---|---|---|---|
| RSI | Neutral | Neutral | Neutral | Neutral | Overbought |
| MACD | Bearish | Bearish | Bearish | Bearish | Bearish |
| Long EMA | Uptrend | Uptrend | Uptrend | Uptrend | Uptrend |
| Medium EMA | Uptrend | Uptrend | Uptrend | Uptrend | Uptrend |
| Short EMA | Uptrend | Uptrend | Uptrend | Uptrend | Uptrend |
| Long SMA | Uptrend | Uptrend | Uptrend | Uptrend | Uptrend |
| Medium SMA | Uptrend | Uptrend | Uptrend | Uptrend | Uptrend |
| Short SMA | Uptrend | Uptrend | Uptrend | Uptrend | Uptrend |
| PSAR | Uptrend | Uptrend | Uptrend | Uptrend | Uptrend |
| Stochastic Oscillator | Neutral | Neutral | Neutral | Neutral | Neutral |
| William R | Neutral | Neutral | Overbought | Overbought | Neutral |
| MFI | Neutral | Neutral | Neutral | Neutral | Overbought |
| Stochastic RSI | Neutral | Overbought | Overbought | Overbought | Overbought |
Top 5 Bearish Crypto Tokens
| Indicator | OAX (Rating: -8) | STEEM (Rating: -8) | WIN (Rating: -8) | LSK (Rating: -9) | REQ (Rating: -9) |
|---|---|---|---|---|---|
| RSI | Neutral | Neutral | Neutral | Neutral | Neutral |
| MACD | Bearish | Bearish | Bearish | Bearish | Bearish |
| Long EMA | Downtrend | Downtrend | Downtrend | Downtrend | Downtrend |
| Medium EMA | Downtrend | Downtrend | Downtrend | Downtrend | Downtrend |
| Short EMA | Downtrend | Downtrend | Downtrend | Downtrend | Downtrend |
| Long SMA | Downtrend | Downtrend | Downtrend | Downtrend | Downtrend |
| Medium SMA | Downtrend | Downtrend | Downtrend | Downtrend | Downtrend |
| Short SMA | Downtrend | Downtrend | Downtrend | Downtrend | Downtrend |
| PSAR | Downtrend | Downtrend | Downtrend | Downtrend | Downtrend |
| Stochastic Oscillator | Oversold | Neutral | Neutral | Neutral | Neutral |
| Williams R | Neutral | Neutral | Neutral | Neutral | Neutral |
| MFI | Overbought | Neutral | Neutral | Neutral | Neutral |
| Stochastic RSI | Neutral | Neutral | Neutral | Overbought | Overbought |
Data Creation and Methodology
In constructing this meticulous analysis, we comprehensively assessed over 100 cryptocurrency tokens, leveraging a series of sophisticated financial indicators to delineate the current market sentiments. Here, we elaborate on the process and the specific indicators utilized in our analytical model:
- Relative Strength Index (RSI): Utilized to gauge the magnitude of recent price changes to evaluate overbought or oversold conditions in the price of a stock or other asset.
- Moving Average Convergence Divergence (MACD): A trend-following momentum indicator that shows the relationship between two moving averages of a security’s price.
- Long, Medium, and Short Exponential Moving Average (EMA): These indicators give greater weight to the most recent prices and react more quickly to price changes than simple moving averages. The long, medium, and short classifications refer to the period considered in calculating the average.
- Long, Medium, and Short Simple Moving Average (SMA): These indicators average a set of prices over some time, with equal weighting to all price points. The long, medium, and short classifications pertain to the respective durations of time used in the computations.
- Parabolic SAR (PSAR): A time/price technical analysis tool used to identify potential reversals in the market price direction of traded goods such as securities, futures, and currencies.
- Stochastic Oscillator: A momentum indicator that compares a particular closing price of a security to a range of its prices over a certain period.
- Williams %R (WILLR): A momentum indicator that measures overbought and oversold levels, similar to the stochastic oscillator and RSI.
- Money Flow Index (MFI): A momentum indicator that uses a stock’s price and volume to predict the reliability of the current trend.
- Stochastic RSI (Stoch RSI): This indicator applies the stochastic oscillator formula to RSI values rather than price values, assessing RSI’s internal strength and durability.
The systematic application of these indicators across more than 100 tokens enabled a rigorous and nuanced analysis. The tokens depicted in the preceding section represent the extremities of the market trends, embodying the most bullish and bearish sentiments at the current juncture.
This robust analytical framework offers investors a grounded and data-driven foundation upon which to base their investment decisions, navigating the volatile cryptocurrency market with enhanced precision and insight.
Your Next Step(s)
→ Check out the CryptoKnowledge Platform and enhance your trading skills
→ Start trading on Binance


1 comment