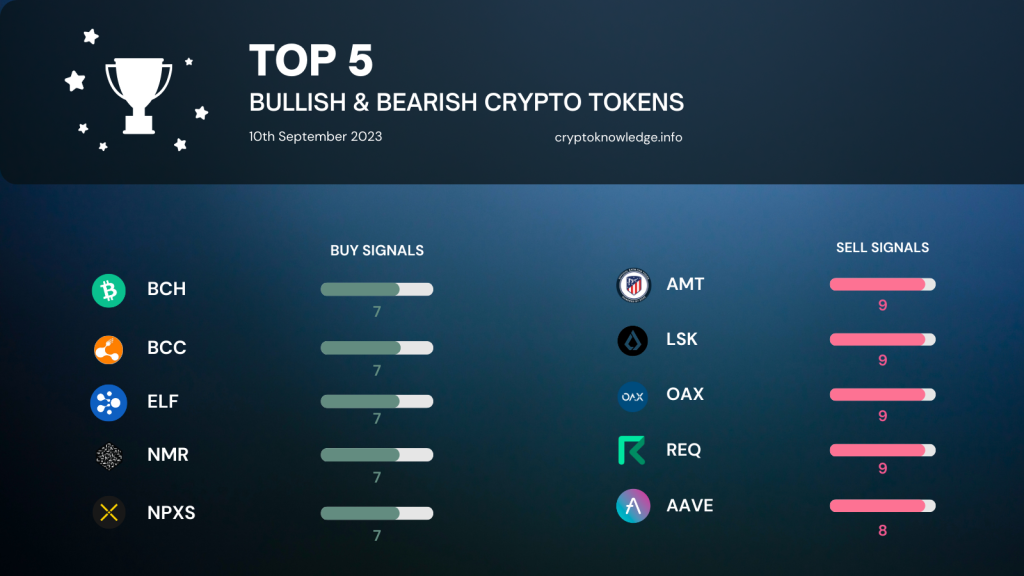
Here’s today’s edition of the Top Bullish and Bearish tokens. Again, we analyzed more than 100 crypto tokens according to nine technical indicators. And here’s the result: The tokens with the most buy and sell signals according to the analyzed indicators.
Spotlight on Top 5 Bullish Crypto Tokens
In this section, we analyze the tokens that are showing promising upward trends based on several technical indicators.
Compared to yesterday’s data, the tokens did change only slightly. With NPXS, we have one new token. At the same time, Tron (TRX) is no longer in the top 5 bullish tokens list. From a ranking point-of-view, Bitcoin Cash (BCH) and BitConnect climbed the ladder and ranked first and second. At the same time, aelf moved from the first to third position.
1. BCH (Bullish: 7, Neutral: 3, Bearish: 3)
- Overbought Indicators: Willr, Stochastic RSI
- Uptrend Indicators: Long, medium, and short-term EMA and SMA, and PSAR
- Neutral Indicators: RSI, Stochastic Oscillator, MFI
- Bearish Indicator: MACD
2. BCC (Bullish: 7, Neutral: 3, Bearish: 3)
- Overbought Indicators: Willr, Stochastic RSI
- Uptrend Indicators: Long, medium, and short-term EMA and SMA, and PSAR
- Neutral Indicators: RSI, Stochastic Oscillator, MFI
- Bearish Indicator: MACD
3. ELF (Bullish: 7, Neutral: 5, Bearish: 1)
- Uptrend Indicators: Long, medium, and short-term EMA and SMA, and PSAR
- Neutral Indicators: RSI, Stochastic Oscillator, Willr, MFI, Stochastic RSI
- Bearish Indicator: MACD
4. NMR (Bullish: 7, Neutral: 2, Bearish: 4)
- Overbought Indicators: RSI, MFI, Stochastic RSI
- Uptrend Indicators: Long, medium, and short-term EMA and SMA, and PSAR
- Neutral Indicators: Stochastic Oscillator, Willr
- Bearish Indicator: MACD
5. NPXS (Bullish: 7, Neutral: 2, Bearish: 4)
- Overbought Indicators: RSI, MFI, Stochastic RSI
- Uptrend Indicators: Long, medium, and short-term EMA and SMA, and PSAR
- Neutral Indicators: Stochastic Oscillator, Willr
- Bearish Indicator: MACD
Spotlight on Top 5 Bearish Crypto Tokens
Next, we focus on the tokens that are currently showing downward trends based on various technical indicators.
Compared to yesterday’s data, we have two new tokens: ATM and AAVE. It’s interesting to see that ATM entered the top 5 bearish tokens directly at the first position. A very unglamorous performance. With AAVE, we have a major crypto token ranked in the top 5 bearish tokens for the first time.
1. ATM (Bullish: 1, Neutral: 3, Bearish: 9)
- Oversold Indicators: Williams R
- Downtrend Indicators: Long, medium, and short-term EMA and SMA, and PSAR
- Neutral Indicators: RSI, Stochastic Oscillator, MFI
- Overbought Indicators: Stochastic RSI
2. LSK (Bullish: 0, Neutral: 4, Bearish: 9)
- Downtrend Indicators: Long, medium, and short-term EMA and SMA, and PSAR
- Neutral Indicators: RSI, Stochastic Oscillator, Willr, MFI
- Overbought Indicators: Stochastic RSI
3. OAX (Bullish: 1, Neutral: 3, Bearish: 9)
- Oversold Indicator: Stochastic Oscillator
- Overbought Indicators: MFI, Stochastic RSI
- Downtrend Indicators: Long, medium, and short-term EMA and SMA, and PSAR
- Neutral Indicators: RSI, Willr
4. REQ (Bullish: 0, Neutral: 4, Bearish: 9)
- Overbought Indicators: Stochastic RSI
- Downtrend Indicators: Long, medium, and short-term EMA and SMA, and PSAR
- Neutral Indicators: RSI, Stochastic Oscillator, Willr, MFI
5. AAVE (Bullish: 2, Neutral: 3, Bearish: 8)
- Overbought Indicators: Stochastic Oscillator, Stochastic RSI
- Uptrend Indicators: Short-term EMA and SMA
- Downtrend Indicators: Long and medium-term EMA and SMA, and PSAR
- Neutral Indicators: RSI, Willr, MFI
Data Creation and Methodology
In constructing this meticulous analysis, we comprehensively assessed over 100 cryptocurrency tokens, leveraging a series of sophisticated financial indicators to delineate the current market sentiments. Here, we elaborate on the process and the specific indicators utilized in our analytical model:
- Relative Strength Index (RSI): Utilized to gauge the magnitude of recent price changes to evaluate overbought or oversold conditions in the price of a stock or other asset.
- Moving Average Convergence Divergence (MACD): A trend-following momentum indicator that shows the relationship between two moving averages of a security’s price.
- Long, Medium, and Short Exponential Moving Average (EMA): These indicators give greater weight to the most recent prices and react more quickly to price changes than simple moving averages. The long, medium, and short classifications refer to the period considered in calculating the average.
- Long, Medium, and Short Simple Moving Average (SMA): These indicators average a set of prices over some time, with equal weighting to all price points. The long, medium, and short classifications pertain to the respective durations of time used in the computations.
- Parabolic SAR (PSAR): A time/price technical analysis tool used to identify potential reversals in the market price direction of traded goods such as securities, futures, and currencies.
- Stochastic Oscillator: A momentum indicator that compares a particular closing price of a security to a range of its prices over a certain period.
- Williams %R (WILLR): A momentum indicator that measures overbought and oversold levels, similar to the stochastic oscillator and RSI.
- Money Flow Index (MFI): A momentum indicator that uses a stock’s price and volume to predict the reliability of the current trend.
- Stochastic RSI (Stoch RSI): This indicator applies the stochastic oscillator formula to RSI values rather than price values, assessing RSI’s internal strength and durability.
The systematic application of these indicators across more than 100 tokens enabled a rigorous and nuanced analysis. The tokens depicted in the preceding section represent the extremities of the market trends, embodying the most bullish and bearish sentiments at the current juncture.
This robust analytical framework offers investors a grounded and data-driven foundation upon which to base their investment decisions, navigating the volatile cryptocurrency market with enhanced precision and insight.
Your Next Step(s)
→ Check out the CryptoKnowledge Platform and enhance your trading skills
→ Start trading on Binance