Current Status – FTM Trading at $0.24 Amid Market Uncertainties
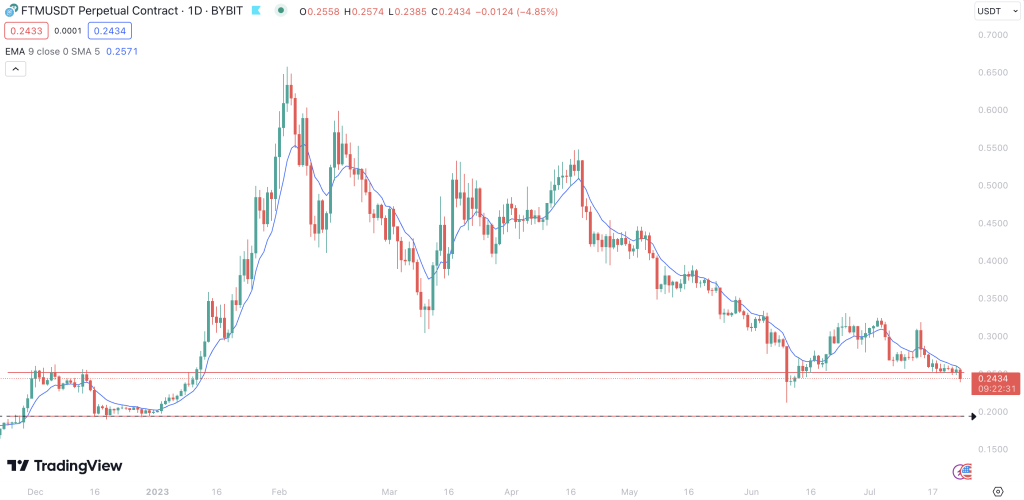
Currently, FTM, the native token of the Fantom platform, is trading at a price of $0.24. Over the past 24 hours, the token’s price has decreased by -4.9%, demonstrating the token’s exposure to market volatility. Recently, FTM’s price experienced a notable bounce from the $0.20 support level, a classic sign of an oversold market condition where the Relative Strength Index (RSI) dipped below 30.
The price momentarily broke above the $0.30 resistance but failed to maintain its position. This indicates a tug-of-war between buyers and sellers in the market. The key benchmark for the token now is to break past the 200-day moving average, which sits around $0.38, to signal a trend reversal. On the downside, $0.20 is the mark to watch.
Decoding FTM’s Technical Indicators
Technical indicators provide a bird’s eye view of how a crypto asset is performing, offering insights into potential future price movements.
For FTM, the current trends based on the moving average show a short, medium, and long-term downtrend. This pattern suggests that the token is currently in a bearish phase across all time frames.
The RSI, a popular momentum indicator, is currently neutral. This suggests that the token is neither overbought nor oversold at the moment, indicating a balance between buying and selling pressures.
Meanwhile, the Moving Average Convergence Divergence (MACD), another momentum-based indicator, shows a bearish signal. This signifies that short-term momentum is slower than long-term momentum, often a sell signal for many traders.
Similarly, the Ultimate Oscillator combines short, medium, and long-term market trends and is also bearish. This suggests that the overall momentum for FTM is downward, aligning with the observed downtrends.
Lastly, the Average Directional Index (ADX), an indicator used to determine the strength of a trend, is currently weak for FTM. This indicates that the existing bearish trend is losing its strength and could potentially reverse.
Trade Setup & Outlook – Strategizing Amid Downtrends
Given the current status and technical indicators, it is crucial for traders and investors to exercise caution and devise an appropriate strategy. The immediate hurdle for FTM lies at $0.30 resistance, and a confirmed breakout above this level could attract further buying interest. On the flip side, the $0.20 level is the primary support and a breach below this could increase selling pressure.
However, the relatively weak ADX coupled with neutral RSI might indicate the potential for a trend change in the near term. Traders should watch the MACD and Ultimate Oscillator for more bearish-to-bullish signals.
At this stage, both patience and discipline are essential. It would be prudent for traders to wait for clearer signals of a trend reversal, such as a break above the 200-day moving average, before initiating any significant long positions.
About FTM – The Backbone of Fantom Platform
FTM is the native token of the Fantom platform, a high-performance, scalable, and secure smart-contract platform. It is designed to overcome the limitations of previous-generation blockchain platforms. Fantom is permissionless, decentralized, and open-source.
The FTM token is at the heart of the Fantom ecosystem. It is used for securing the network through its staking model, for governance votes to determine the direction of the network upgrades and developments, and for payment of transaction fees.
Summing Up – The FTM Price Story and Future Possibilities
In conclusion, FTM is currently in a bearish phase, as evidenced by its price trends and various technical indicators. However, the neutral RSI and weak ADX provide some hope for a possible change in trend. The key lies in the $0.30 resistance and the 200-day moving average.
It’s important to remember that, as with all investments, risks come hand in hand with potential rewards. As the backbone token of the innovative Fantom platform, FTM carries considerable potential in the fast-growing world of digital assets. However, given the inherent volatility in the cryptocurrency market, a cautious approach, combined with regular monitoring of the market and its indicators, is advisable.
The trading setup highlighted here was identified using a comprehensive crypto screener, showing how vital such tools can be in spotting potential trading opportunities in the dynamic crypto market. Stay tuned for further updates and analysis on FTM and other digital assets.