Solana (SOL) commands our attention this September. Based on a noticeable price performance and trend indicators that are hard to ignore in the dynamic arena of cryptocurrencies is complex. Currently positioned at $19.96, with a 1.82% uptick in the last 24 hours. On top of that, SOL presents a mixture of opportunities and challenges for investors. Let’s dissect the recent data to provide you with an insightful analysis of Solana and a solid fundament for decisions in September.
Check out our latest article about Ethereum and Bitcoin
→ Ethereum’s September Analysis: Key Insights and Trade Recommendations
→ Bitcoin Price Update: Your Week-Ahead Outlook Unpacked!
Price Performance: Unraveling the Trends
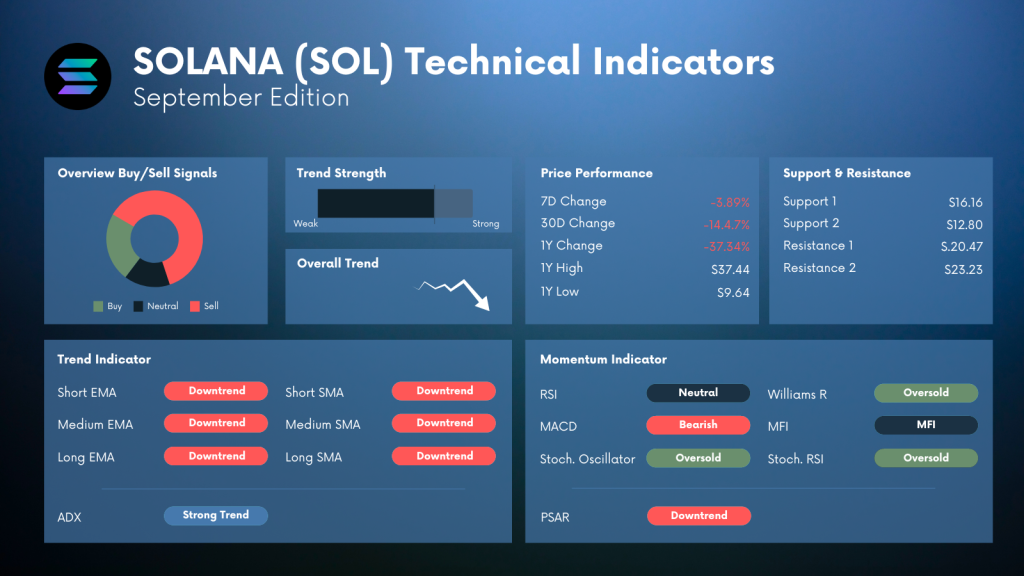
SOL has been experiencing some volatility, which is evident from its recent price fluctuations. Over the last week, the token has decreased by 3.89%, with a more substantial dip of 14.47% over the last month.
If we take a broader look at the yearly change, SOL has contracted by 37.34%, unable to maintain momentum towards its 1-year high of $37.44.
Support & Resistance Levels: What’s Next?
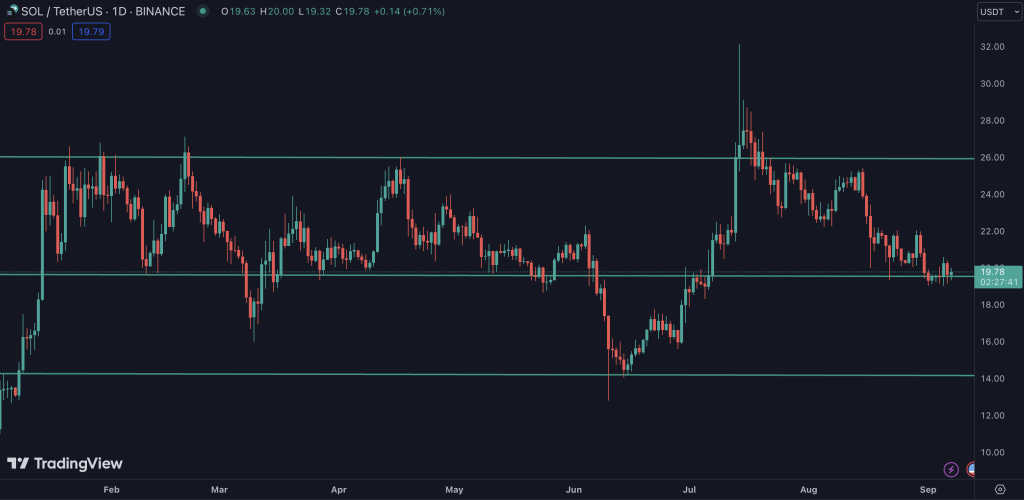
Investors should keep a keen eye on SOL’s support and resistance levels, which could be significant indicators for making informed decisions. The primary support level is $16.16, with a secondary base at $12.80, potentially holding ground. Meanwhile, resistance levels are sketched at $20.47 and $23.23, which SOL must breach to pave the way for a bullish run.
On top of that, the charts below indicate that Solana (SOL) trades at a pivotal point. Depending on the upcoming days, we could either see the initiation of a rebound towards $26 or a further dip to $14. Let’s have a look at the most important technical indicators to back our recommendation with an insightful analysis of Solana.
Solana (SOL) Analysis: Trend Strength & Indicators
Solana is amidst a strong trend, as indicated by the various technical indicators:
- EMA & SMA: Short-, medium, and long-term Exponential Moving Averages (EMAs) and Simple Moving Averages (SMAs) all signal a downtrend. This implies that SOL has been on a declining trajectory across different time frames.
- ADX: The Average Directional Index portrays a strong trend, emphasizing the significant momentum in the current trend, albeit in a downward direction.
- Momentum Indicators: The RSI is neutral, presenting a balanced scenario. However, a bearish MACD coupled with indicators such as the Stochastic Oscillator and Stochastic RSI hinting at oversold conditions suggest we might witness a reversal or stabilization soon. The Williams R and the Money Flow Index (MFI) further complement this view, being in the oversold and neutral zones, respectively.
- Volatility Indicator: The PSAR, indicating a downtrend, warns investors of possible continued downward pressures.
Short-Term & Long-Term Trade Recommendation
In the short-term, trading Solana (SOL), from our point of view, stands and falls with the token’s performance when battling the $20 support area. Once this level is sustainably broken, Solana will most likely revisit the $14 area. Subsequently, this could lead to a potential gain of 25%. Conversely, backed by the broader market, a strong bounce could quickly propel Solana towards $26.
We do not expect Solana (SOL) to initiate some major moves in the long term. On the contrary, continuing the sideway movements seems likely — especially based on the current technical indicators.
Want to know more about Solana?
Solana Adds 10% — Daily Crypto Market Cap Analysis
Chart Analysis: Why Solana (SOL) is Ready to Reconquer $20
Solana’s SOL in Bearish Grip: The Numbers Behind the Slide
Solana Analysis — Wrap-Up
As we navigate through September, SOL paints a complex picture. With strong downward trends indicated by various metrics, caution might be the best approach for investors now.
Yet, the oversold conditions signal potential opportunities for a rebound. Keeping a close eye on the support and resistance levels would be crucial in strategizing for what seems to be an unpredictable month for Solana.
In a nutshell, Solana appears to be at a decisive phase. Despite a strong downtrend, the crypto token shows signs of potential recovery. As we venture into September, a cautious yet hopeful approach might be the key to unlocking opportunities with Solana. This chapter summarizes the analysis, providing readers with a quick recap and insights into what lies ahead for SOL in September.
About Solana – A Glimpse into the World of Solana (SOL)
Solana is a high-performance cryptocurrency blockchain that promises scalability and faster transactions at lower costs. Despite its current market downtrends, its underlying technology and potential make it a notable player in the crypto space. As we venture into September, understanding Solana’s background and its core features can equip investors with the knowledge to make informed decisions in the volatile market landscape.
Your Next Step(s)
→ Check out the CryptoKnowledge Platform and enhance your trading skills
→ Start trading Solana