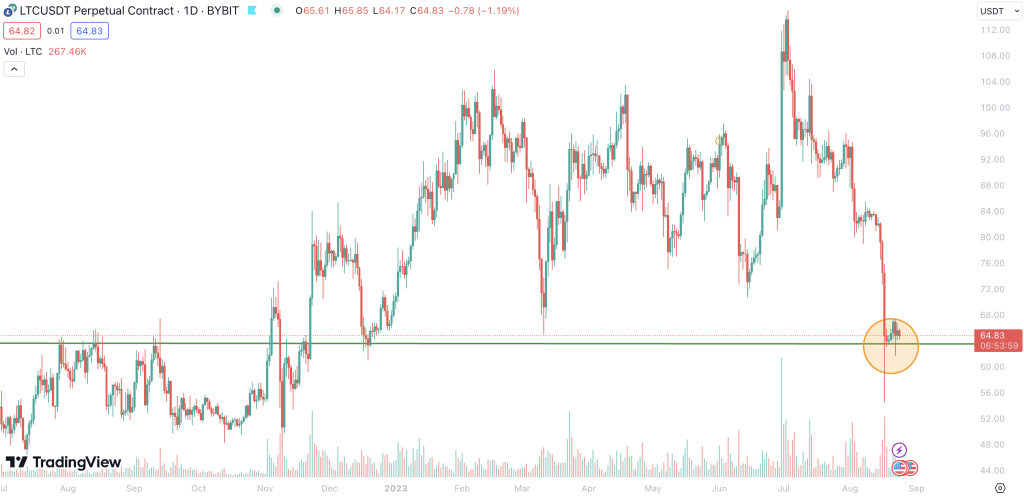
Litecoin (LTC), the digital silver to Bitcoin’s gold, currently trades at a figure of $64.8. Over the past 24 hours, this cryptocurrency experienced a decline of -1.2%, leaving investors and traders cautious but attentive. This decline has brought the price down from a previous high of $116 to now rest at a substantial support level of around $62.
Market experts and technical analysts, observing the oversold status of the Relative Strength Index (RSI), anticipate a potential recovery. They project a bounce in the price towards the $70-72 range, offering an enticing 10% profit.
However, this silver lining is not without its cloud. All major indicators lean bearish, urging traders to monitor the overall market sentiment. If the bearish market persists, we might witness Litecoin’s price plummet further to touch the $55 mark.
Litecoin (LTC) — Technical Indicators
Here are LTC’s most essential technical indicators and their potential impact on Litecoin’s future development. Overall, the indicators paint a dark and bearish picture. Nevertheless, this isn’t surprising after Litecoin’s sharp decline. Nevertheless, and as already mentioned, the RSI might reflect a turning point. Let’s dive into the details:
Trends Based on Moving Average
The moving average in the short term suggests a downtrend for LTC, meaning recent prices are lower than the average. On top of that, the Simple Moving Average (SMA) for the medium-term also portrays a descending trajectory, indicating a consistent bearish momentum over recent weeks. And stretching out to the longer-term perspective, the SMA continues to indicate a downward trend, hinting at a sustained bearish sentiment.
RSI Oversold
The Relative Strength Index (RSI) signals an ‘oversold’ status. This typically means the asset might be undervalued and could experience a reversal or bounce back soon.
MACD Bearish
The Moving Average Convergence Divergence (MACD) currently leans bearish for Litecoin. This suggests that the asset’s momentum is heading downward, and the bears dominate the market.
Oscillator Bearish
The oscillator for LTC is also indicating bearish sentiments. Oscillators can help traders identify potential price reversals, and a bearish oscillator hints at a continuation of the downtrend.
ADX: Strong
The Average Directional Index (ADX) suggests a strong trend. Although it doesn’t specify the direction of the trend, combined with other indicators, it’s evident that the prevailing strong trend is bearish.
Litecoin: Potential Trade Setup & Outlook: Traversing
Given the current indicators, Litecoin’s immediate future seems to lean bearish. The persistent downtrend across short-, medium-, and long-term SMAs speaks volumes about the prevailing market sentiment. However, the oversold RSI offers a glimmer of hope.
Traditionally, an oversold RSI has been an indicator of an impending price reversal. This suggests that there might be a bounce, potentially bringing LTC’s price to the range of $70-72. Yet, traders must tread carefully. The bearish MACD and Oscillator, coupled with a strong ADX might suppress this bounce.
If the broader crypto market continues its bearish phase, the $55 mark might become a reality for LTC. Short-term traders eyeing the 10% profit should maintain tight stop losses and remain agile in this dynamic landscape.
About LTC: The Digital Silver’s Tale
Litecoin (LTC) emerged as the silver counterpart to Bitcoin’s gold. Launched in 2011 by Charlie Lee, it was one of the first cryptocurrencies to follow Bitcoin’s footsteps. Leveraging a different hashing algorithm, quicker block generation times, and a more democratized mining process, LTC aimed to offer improved transaction speeds and security. Over the years, it has cemented its place as one of the top cryptocurrencies by market cap, bridging the gap between the technological world of blockchain and everyday users.
Wrap-up: Litecoin’s Crucial Crossroads
In the dynamic world of cryptocurrencies, Litecoin stands at a crucial crossroads. With its current price at $64.8, it has experienced a recent dip from a robust $116. Although indicators predominantly suggest a bearish sentiment, an oversold RSI points towards a potential bounce back, aiming for the $70-72 region.
However, given the powerful bearish indicators, traders must remain vigilant and responsive. As LTC navigates these challenging waters, its history as the digital silver offers a testament to its resilience and potential in the crypto realm.