Alright, let’s set the scene. Imagine me, scrolling through countless strategies, sifting through myriad charts and indicators, when — bam! — I stumble upon a strategy that, at first glance, already looks promising.
Fellow traders and crypto enthusiasts, allow me to introduce the Parabolic Trader strategy that’s recently piqued my interest. This isn’t just any old trading strategy. This is a refined amalgamation of indicators and conditions that, when played right, boasts a high success rate.
Therefore, this article will dissect the strategy and discuss the ingredients, how it works, and the results.
Let’s get it started!
Breaking Down the 70% Success Rate Strategy
The Parabolic Trader is a strategy that combines different technical indicators. First of all, at its core, the Parabolic Trader hinges on the Parabolic SAR (PSAR) indicator (here’s where the name comes from).
But it doesn’t stop there. This strategy combines the PSAR with the Exponential Moving Average (EMA 200) and the Moving Average Convergence Divergence (MACD) to make those crucial buy and sell decisions. Let’s dissect these components:
- Parabolic SAR (PSAR): Think of the PSAR as your guiding star. It helps identify the direction of a token’s momentum and is key in pinpointing possible reversals. However, in the context of this strategy, the PSAR is used to reduce the number of possible trades and increase the probability of a successful trade.
- Exponential Moving Average (EMA 200): The EMA200 defines the overall market trend and derives the trading strategy from it. As in many other strategies, the idea of the Parabolic Trader is only to go long when the price is above the EMA200 and only short when the price is below.
- Moving Average Convergence Divergence (MACD): The MACD is the key indicator for spotting entries. Like other strategies, we are looking at a crossover of the MACD and signal line.
Spotting the Trading Signals
Understanding the strategy’s indicator is great, but knowing when to make your move is key. Here’s your cue to action:
For Going Long (Bullish):
Here’s your checklist for a long trade.
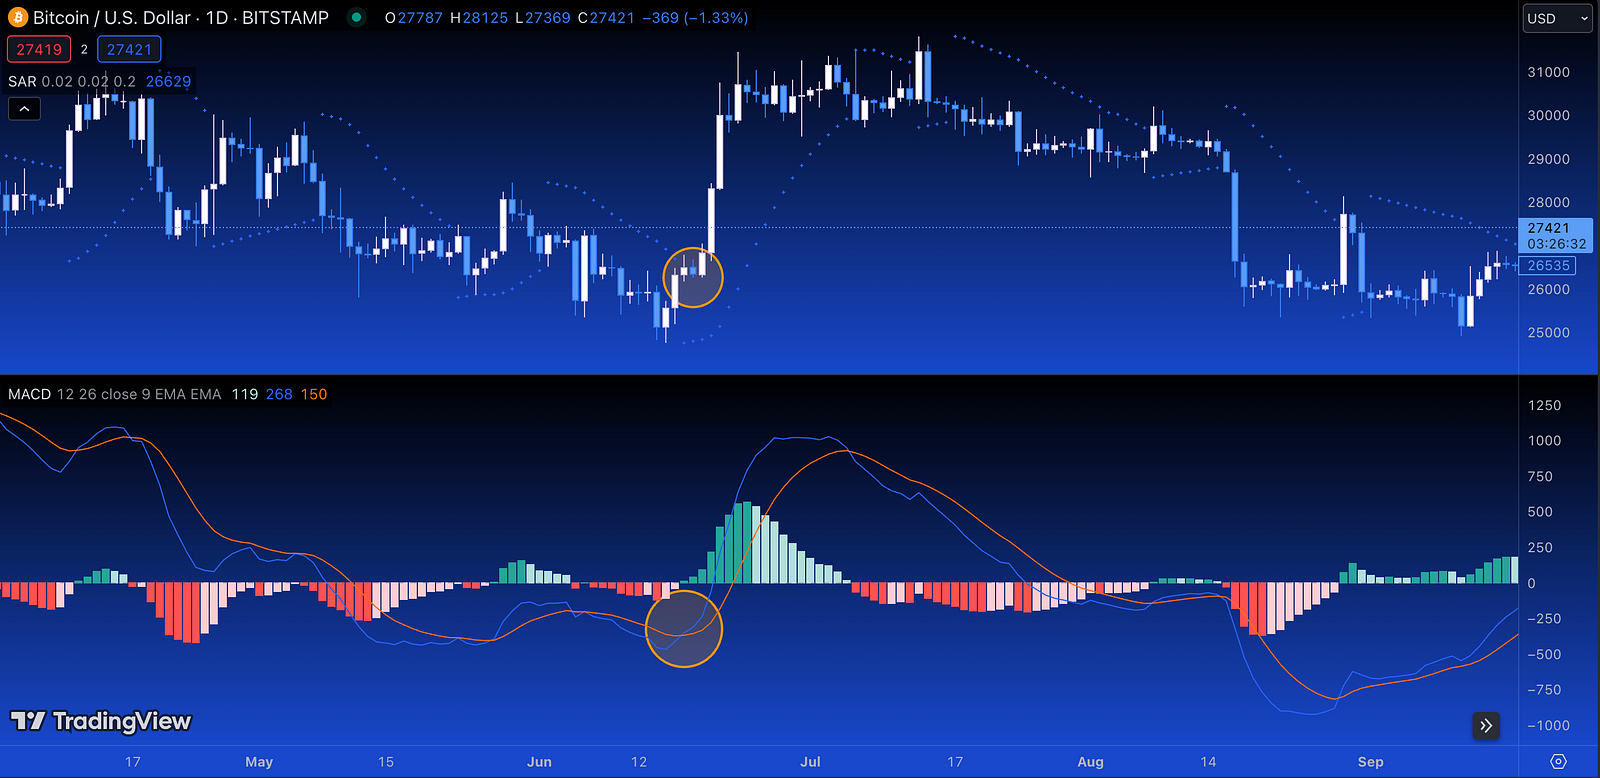
- The closing price of a candle is above the EMA200.
- The MACD has crossed the signal line from bottom to top.
- The price is above the PSAR.
Here’s an example of a long signal:
For Going Short (Bearish):
- The closing price of a candle is below the EMA200.
- The MACD has crossed the signal line from top to bottom.
- The price is below the PSAR.
Exit Signal
A proper exit strategy is often even more important than an entry strategy. Personally, I like strategies that have clearly defined exit triggers (instead of x% profit).
In the case of the Parabolic Trader, the exit is pretty straightforward:
- You close long trades as soon as the price closes below the PSAR
- And you close a short once the price closes above the PSAR
Advanced Exit Signal
Since our backtests have shown that the drawdown can be too high when solely relying on the PSAR as an exit signal, consider enhancing it. We basically used a stop loss as an addition. That means you close the trade either when you reach a loss of x% (e.g., 0.5% or 1%) or when the above PSAR condition hits.
By doing so, we could significantly reduce the drawdown (of course, while sacrificing a percent point of the success rate).
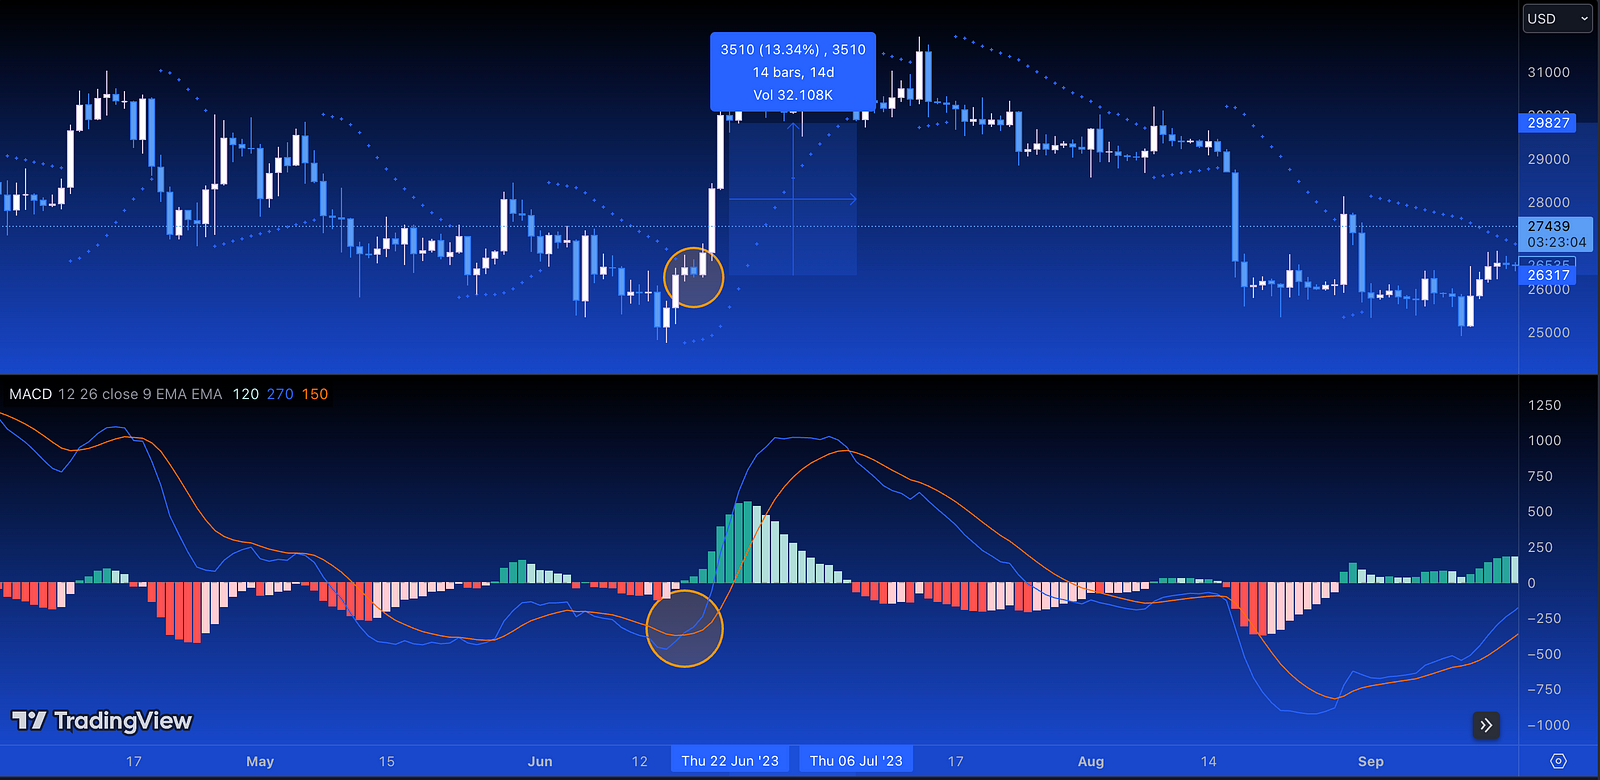
And by the way, in the example above, the exit would have led to a whopping 13% profit while the trade would have been open for two weeks. However, you can, of course, use the strategy on lower timeframes too.
A Strategy Worth Its Salt?
I was blown away to find that in backtests, the Parabolic Trader flaunted a whopping 70% success rate. But remember, past glories don’t always promise future triumphs. Always wear your analytical hats and view this strategy as a broader market analysis toolkit component.
Enriched with an additional stop loss of 1%, we maintained a success rate between 67% and 69%. At the same time, we were able to reduce the max. drawdown to 3%.
How to Utilize the Strategy
As described above, spot entry signals — especially when trading a larger number of assets- are quite complex.
For hands-on traders, applying this strategy manually on TradingView is possible, though it requires a keen eye and proficiency in setting up the said indicators. Each entry or exit condition needs to be scrutinized in real time.
However, for those seeking a streamlined experience, CryptoKnowledge offers a straightforward solution. The platform has pre-configured strategy that allows users to subscribe for real-time signal alerts. This saves time and ensures precision, eliminating the chances of manual oversight.
Wrap-Up
In wrapping up, the Parabolic Trader isn’t just another strategy. It’s a symphony of indicators working in harmony, and when orchestrated correctly, the results can be music to a trader’s ears. Here’s to smart, informed trading! 🥂📈
Your Next Step(s)
→ Check out the CryptoKnowledge platform for more details & data
→ Sign up for our 7-day free Crypto Strategy Trading Email Course
Please note: The information presented in this article is for educational purposes only and does not constitute financial advice. Always do your own research before making any investment decisions.
Disclaimer: The success rate mentioned is based on historical backtests of the Parabolic Trader strategy. It’s important to understand that past performance does not indicate future results. Trading cryptocurrencies and other financial instruments carries risks; no strategy can guarantee profits in every scenario. Always conduct thorough research and seek advice from financial professionals before making investment decisions.