During the last few days, we published several analyses about crypto tokens. However, writing this HBAR analysis was definitely one of the tougher tasks. As you will learn, Hedera, also known as HBAR, presents itself as a token with intriguing dynamics this September. Besides a serious downtrend, HBAR shows some signs of hope in terms of a trend reversal. Therefore, the article delves deep into the technical indicators and what they spell for HBAR enthusiasts. Let’s go!
Check out our latest article about Ethereum and Bitcoin
→ Ethereum’s September Analysis: Key Insights and Trade Recommendations
→ Bitcoin Price Update: Your Week-Ahead Outlook Unpacked!
HBAR Analysis: A Closer Look at the Token’s Price Performance
Let’s start our HBAR analysis with a closer look at the token’s price performance. Unfortunately, the token paints quite a dark picture when looking at HBAR’s price performance. Here are some highlights:
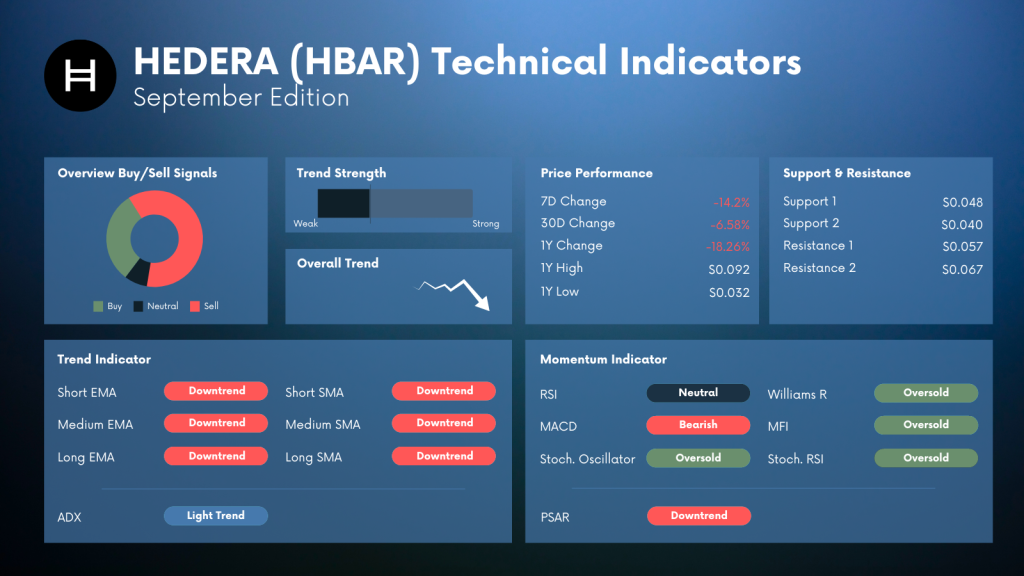
- Over the past week, HBAR has witnessed a significant decline of 14.16%
- The 30-day change is also in the negative territory at -6.58%.
- A retrospective look at the yearly statistics paints a similar picture, showcasing an 18.26% drop.
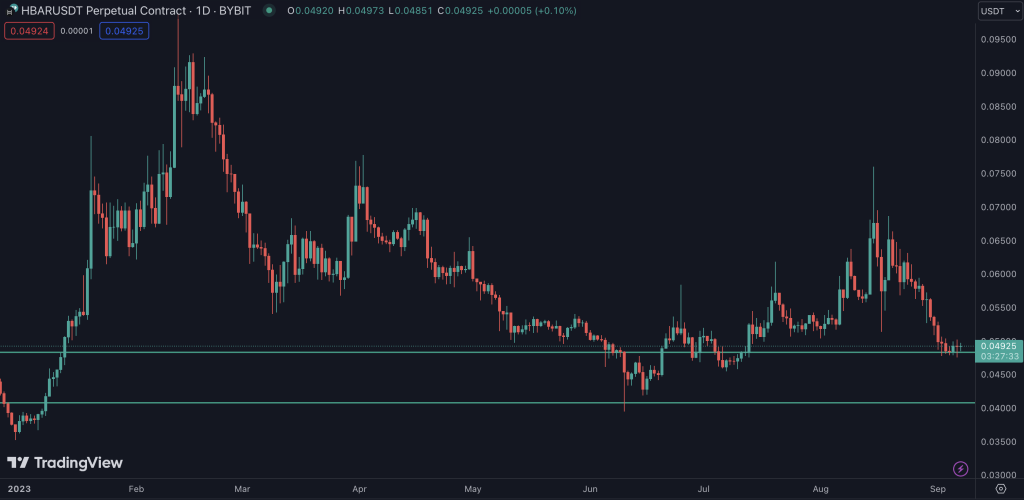
- While the token has struggled to regain its 1-year high of $0.0915, it has stayed afloat above its annual low of $0.0365, indicating a semblance of resistance and potential for recovery.
While the token has struggled to regain its 1-year high of $0.0915, it has stayed afloat above its annual low of $0.0365, indicating a semblance of resistance and potential for recovery.
As you can see in the chart below, HBAR was in a solid upward trend from June to mid-August before it broke the trend to the downside. As a result, HBAR is now battling the resistance at $0.049. Losing that level could bring the token down to $0.04 or below. Let’s see how this situation translates into the most important technical indicators in the next part of our HBAR analysis.
HBAR Support & Resistance Levels: Key Points to Watch
Similar to other crypto tokens, support and resistance levels reflect an essential part of our HBAR analysis.
As we venture further into September, traders should keep a close watch on the critical support and resistance levels that could delineate the future trajectory of HBAR. The initial support is found at $0.048, followed by a stronger base at $0.040. On the flip side, resistance levels are marked at $0.057 and $0.067, which will serve as significant milestones in HBAR’s path to recovery.
Want to read more about Hedera (HBAR)?
→ Harnessing Momentum: The Bullish MACD Crossover and Its Implications on THETA, ENJ, and HBAR
→ HBAR Bulls Eye 10% Upswing: Navigating the Tide in the Hedera Hashgraph Market
→ Eye on HBAR: Delving into Hedera Hashgraph’s Potential 10% Upswing
HBAR Trend Strength & Indicators: A Nuanced Analysis
Currently, HBAR is experiencing a light trend, with several indicators pointing towards a downtrend across various time frames:
Trend Indicators
Analyzing the moving averages as one of the most essential trend indicators, the results speak a clear language: Downtrend!
Both the short–, medium, and long-term Exponential Moving Averages (EMAs) and Simple Moving Averages (SMAs) signal a downtrend, indicating a cautious approach may be warranted in the near term.
However, the ADX, an indicator that measures the strength of a trend, signals only a light trend. Although this seems surprising when looking at the trend indicators, the picture becomes clearer when we consider the momentum indicators.
HBAR Momentum Indicators — Adding an Different View to the HBAR Analysis
Contrary to the trend indicators, HBAR has an entire set of momentum indicators that signal some bullish momentum. The Stochastic Oscillator, Williams R, MFI, and Stochastic RSI indicate that the token is in the oversold territory, possibly hinting at a potential reversal in the trend soon.
And while the Relative Strength Index (RSI) stands at neutral, suggesting a balanced momentum, the MACD remains bearish.
Short-Term & Long-Term Trade Recommendation for HBAR
Given the predominance of downtrend and oversold indicators, the recommendation leans towards a cautious approach in both short and long-term trade scenarios. This might sound unsatisfactory for traders but the current indicators do not allow them to give a clear trade recommendation. And as you know, sometimes the best trade is not to trade at all.
However, risk-proven investors might find opportunities in buying at support levels ($0.048 and $0.040) and aiming for modest gains at resistance levels ($0.057 and $0.067), while being prepared for potential downturns.
Wrap-Up: HBAR Analysis and Trade Recommendations
As we navigate through September, HBAR appears to be in a delicate position, with multiple indicators suggesting a continuation of the downtrend. However, the oversold conditions present a potential for a trend reversal. Investors and traders might want to tread carefully, keeping an eye on the evolving market dynamics and the key support and resistance levels.
About Hedera – Navigating the Hedera Landscape
As a notable player in the crypto arena, Hedera aims to offer a decentralized economy that empowers individuals and businesses globally. Its unique attributes and technology provide a stable platform for the development of decentralized applications, positioning it as a gentle yet steadfast player in the crypto sea. As we navigate through September, keeping an eye on HBAR’s movements can offer insightful learnings and potential investment opportunities.
Your Next Step(s)
→ Check out the CryptoKnowledge Platform and enhance your trading skills
→ Start trading HBAR