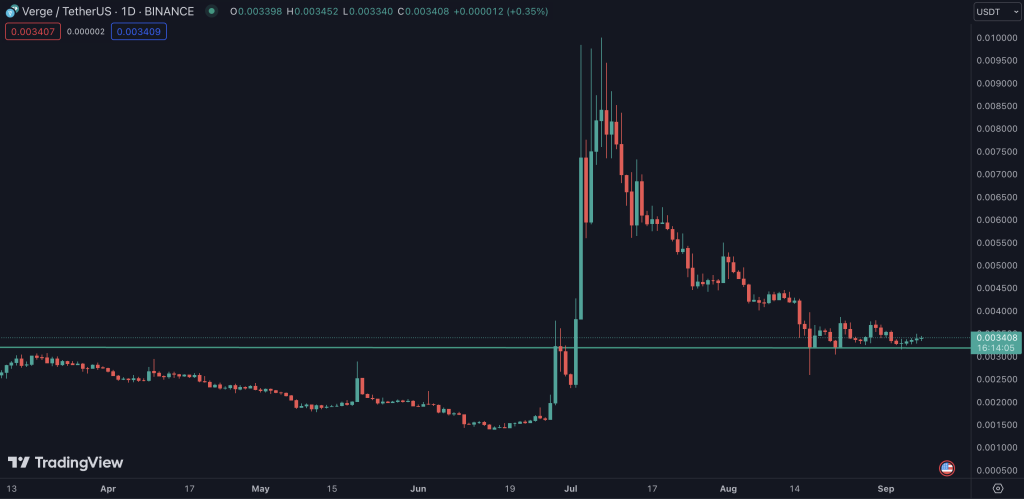
Today, we continue our crypto token analysis for September with Verge (XVG). Verge (XVG) was one of the shining stars this summer when the token climbed almost 700%. Unfortunately, Verge suffered from a sell-off right after and is now trading at a major support level. With this blog post, we dive into the technical indicators of Verge (XVG). On top of that, we provide you with a detailed analysis of Verge (XVG) and a potential trade setup for September.
Check out our latest article about Ethereum and Bitcoin
→ Ethereum’s September Analysis: Key Insights and Trade Recommendations
→ Bitcoin Price Update: Your Week-Ahead Outlook Unpacked!
Verge (XVG) Price Performance Analysis: A Glimpse into the Numbers
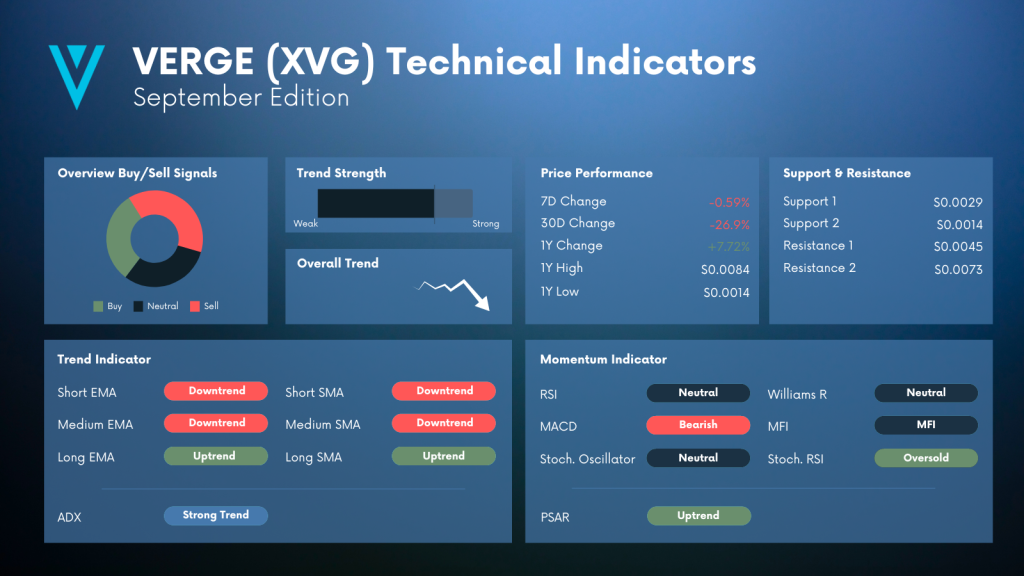
Currently, Verge (XVG) trades at a major support level of $0.003. Here are some price details from a broader perspective:
- Verge (XVG) portrays a relatively stable behavior with a minimal 7-day decrement of 0.59%.
- However, a broader 30-day perspective reveals a substantial dip of 26.9%, hinting at the cryptocurrency’s recent market adversities.
- On a brighter note, a glance at the annual change showcases a positive growth of 7.72%
- Compared to its peak in June, Vege (XVG) has lost ~70%
Verge (XVG): Support & Resistance Thresholds
A vigilant focus on the support and resistance levels can be instrumental in shaping profitable investment strategies. Verge currently consolidates with primary support at $0.0029 and a more potent fallback point at $0.0014, establishing a strong foundation for potential rebounds.
On the flip side, to foster a bullish momentum, it needs to breach the resistance markers set at $0.0045 and subsequently at $0.0073. These thresholds might play pivotal roles in dictating XVG’s trajectory in the imminent future.
More about Verge (XVG)
→ Verge (XVG) Leads Again: Top Gainers & Losers Last 24 Hours
→ Verge (XVG) Pumps 60% — Top & Flop Crypto Tokens
→ Verge Climbs 58% — Here Are The Crypto Gainers & Losers
Verge (XVG) Trend Analysis: Deciphering the Strong Trend
Verge presently navigates through a phase of strong trend as indicated by the trend strength metrics. Here is a deeper insight into the trend indicators:
- EMA & SMA: While the short and long-term EMAs and SMAs signal a downtrend, the medium-term indicators hint at an uptrend, depicting a mixed scenario and, possibly, a transitional phase for XVG.
- ADX: Consistent with the overall trend strength, the ADX indicates a strong trend, emphasizing the momentum XVG is currently experiencing.
Momentum Indicators: Reading the Undercurrents
When looking at Verge’s momentum indicator, one finds a mixed bag of signals. On the one side, we have a couple of neutral indicators, such as the RSI, Stochastic Oscillator, Williams R, and the Money Flow Index (MFI). From our point of view, this also aligns with the sideways trend Verges has been following for some time.
On the other side, we have the MACD that signals a bearish scenario and acts as a sign of cautiousness for our Verge analysis.
However, finally, we have two bullish indicators: The Stochastic RSI and the PSAR. Both can be interpreted as trend reversal indicators.
Verge (XVG) Trade Recommendation
Based on the mixed signals, providing a clear trade recommendation would be untrustworthy. Therefore, the following thoughts should serve as some input for your analysis.
Currently, it is pivotal to monitor the area between $0.0029 and $0.003. A sustainable dip below this level would, most likely, initiate a further downtrend. However, based on our analysis, the technical indicators, and the chart itself, we believe that Verge (XVG) won’t break below this level. On the contrary, it looks like the token has followed an extensive consolidation and is getting ready for another upswing.
Therefore, our short-term approach is to monitor the trend indicator and enter trades once they turn bullish (EMA and/or SMA).
For long-term traders, this level might provide a perfect place for DCA-ing and loading the bags.
Verge (XVG) Analysis – Navigating Through the Trends: Final Thoughts
As Verge (XVG) ventures into September, it portrays a complex narrative with its strong trend dynamics and a sell recommendation as the overall trend. Investors should approach with a strategy that combines caution with vigilance, keenly observing the nuanced shifts in market indicators.
Despite the mixed indicators, Verge stands resilient, showcasing potential for growth and recovery. Investors should closely monitor the evolving market, the mentioned support levels and adjust their strategies accordingly, possibly steering towards a promising trajectory as the month progresses.
Your Next Step(s)
→ Check out the CryptoKnowledge Platform and enhance your trading skills
→ Start trading XVG