September beckons, and as the crypto space continues to whirl with activities, traders and investors are keen to know the prospects of various tokens. This edition highlights Chainlink (LINK), providing a clear, uncomplicated, and professional analysis of its potential this month.
Analysis: A Snapshot of Chainlink (LINK) Current Situation & Technical Indicators
Chainlink, popularly known as LINK, is currently trading at $6.27, enjoying a modest 24-hour increase of 2.10%. The following sub-chapters will delve into LINK’s technical indicators. Based on this analysis, we can provide a proper trade recommendation in the subsequent chapter.
Check out our latest article about Ethereum and Bitcoin
→ Ethereum’s September Analysis: Key Insights and Trade Recommendations
→ Bitcoin Price Update: Your Week-Ahead Outlook Unpacked!
Chainlink Price Performance – Mapping the Recent Trends
Before we delve deeper into the analysis of technical indicators, let’s first take a look at Chainlink’s recent price performance.
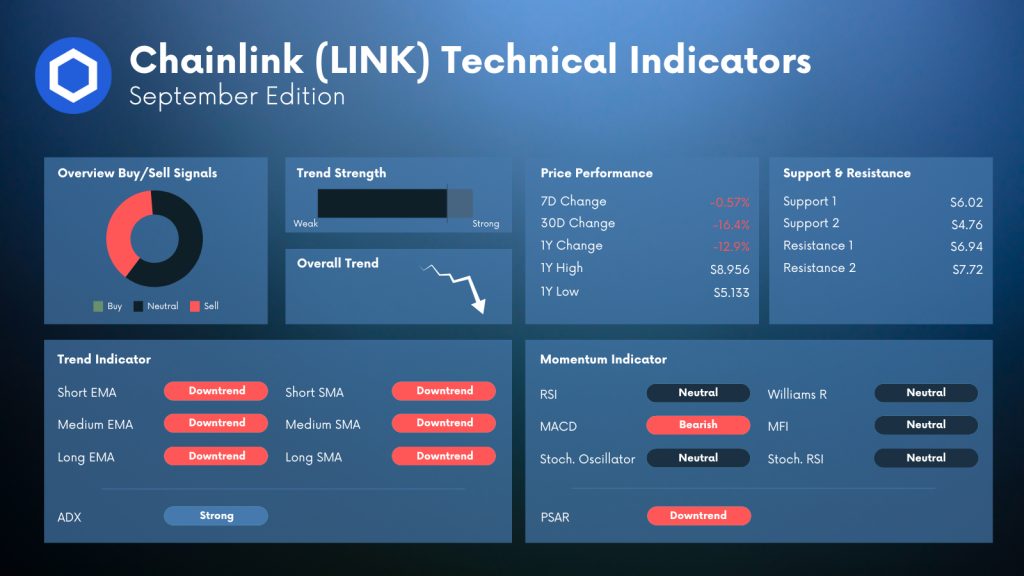
- Over the past week, the coin has slightly decreased by 0.57%.
- More noticeably, the monthly decline accounts for 16.39%.
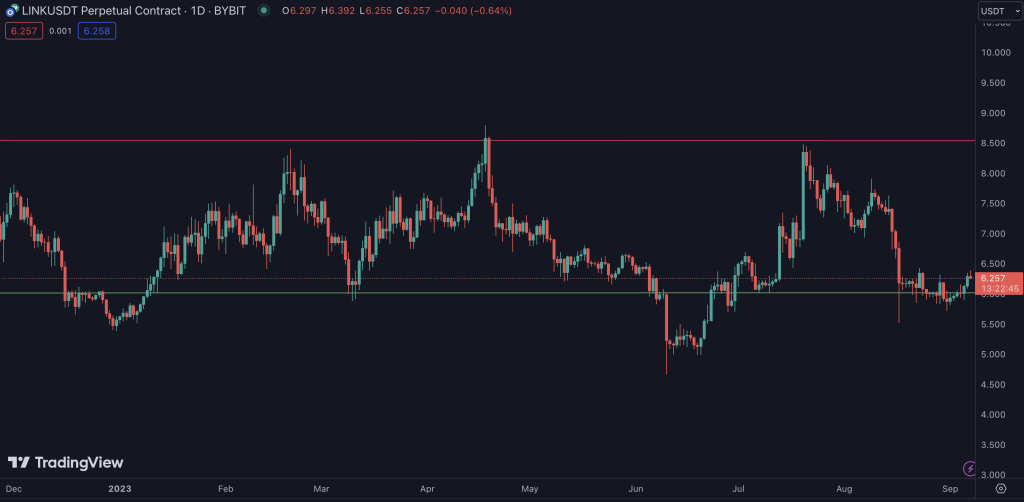
- Even worse, the yearly overview shows a 12.93% dip, with the highest and lowest points recorded at $8.956 and $5.133, respectively.
However, when zooming out and looking at the below price chart of LINK, one can see that LINK has been trading in a sideways channel for the entire year.
Chainlink Trend Analysis
Based on the recent declines, the market trend for LINK is noted as a bearish setup, backed by a strong trend strength.
A careful analysis of the trend indicators, spanning from short to long-term EMAs and SMAs, all signal a consistent downtrend. The ADX indicator backs this up, pointing at a strong ongoing trend.
Chainlink’s Momentum Indicators
The analysis of momentum indicators portrays a mixed scene for Chainlink — similar to many other tokens at this stage.
The RSI, Stochastic Oscillator, Williams R, MFI, and Stochastic RSI all hold a neutral position, hinting at a steady market momentum. However, the MACD suggests a bearish trend, signaling that caution should be maintained.
On the other hand, the PSAR also indicates a downtrend, hinting at a possible continued decline in price.
Chainlink: Short-Term & Long-Term Trade Recommendation
At this point, and based on the above analysis it is complex to give a solid trade recommendation for Chainlink.
With the prevailing market indicators, traders might consider adopting a cautious stance while trading Chainlink (LINK) in September. The general downtrend suggests a potential risk for substantial investments. However, with the support and resistance levels standing at $6.02, $4.76, $6.94, and $7.72, respectively, adept traders might find opportunities to trade effectively within these bounds.
Especially if the overall market won’t go south, the current level offers a good entry for a swing trade back to $7.
More about Chainlink
→ Bearish Pressure Pulls Chainlink to $5.38: Time to Sell or Time to HODL?
→ Bullish Outlook: Chainlink (LINK) Aims for 40% Gain
Chainlink Analysis: What’s in for September
In conclusion, LINK seems to be entering a phase where careful strategy and caution could be the underlying themes for September.
The current market conditions suggest opportunities and risks, making it advisable to adopt a measured approach for short-term trades or long-term investments.
About Chainlink (LINK) – Unfurling the Chainlink Story
Chainlink, abbreviated as LINK, has emerged as a significant player in the cryptocurrency arena. It facilitates secure and reliable tamper-proof data for complex smart contracts on any blockchain. Despite facing a challenging market situation recently, Chainlink remains a critical tool in the blockchain space, heralding potential growth and innovation opportunities in the coming months.
Your Next Step(s)
→ Check out the CryptoKnowledge Platform and enhance your trading skills
→ Start trading Chainlink